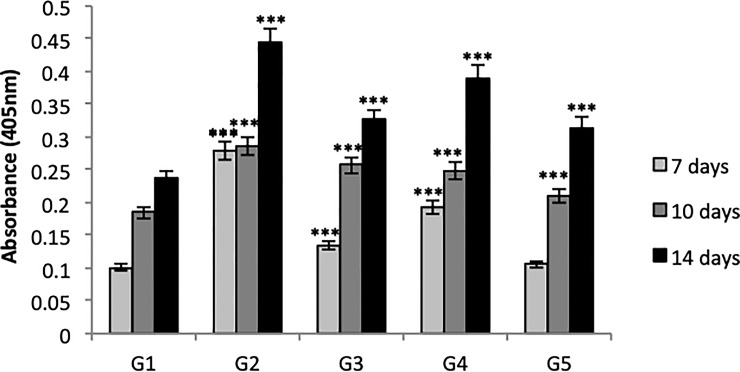
Fig 9. Quantitative analysis of mineral nodules by Alizarin Red in G1, G2, G3, G4, and G5 at 7, 10, and 14 days.
Bars indicate the highest osteogenic potential of cultures according to investigated material +/- standard error. One-way ANOVA followed by Tukey's test. *** = p <0.001 compared to the G1 control group.

