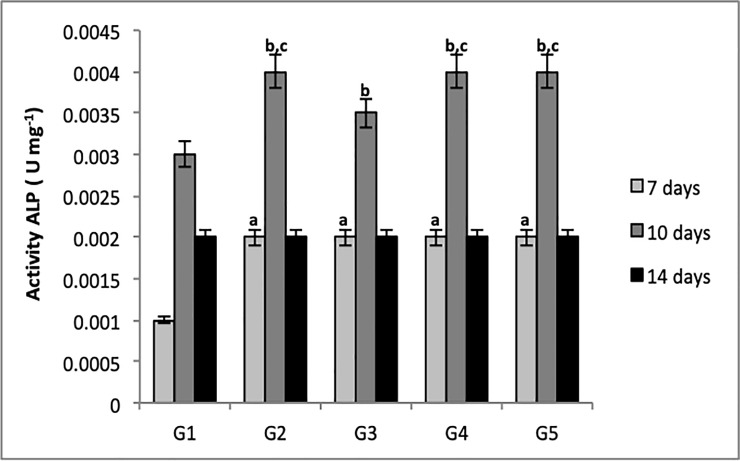
Fig 10. Quantitative analysis of ALP activity in G1, G2, G3, G4 and G5 at 7, 10, and 14 days at 595 nm.
Bars indicate ALP activity according to group +/- standard error. One-way ANOVA followed by Tukey's test. Letters indicate statistically significant differences; a = p<0.001 compared to G1 (control group—7 days), b = p<0.001 compared to G1 (control group—10 days), c = p<0.001compared to G3.

