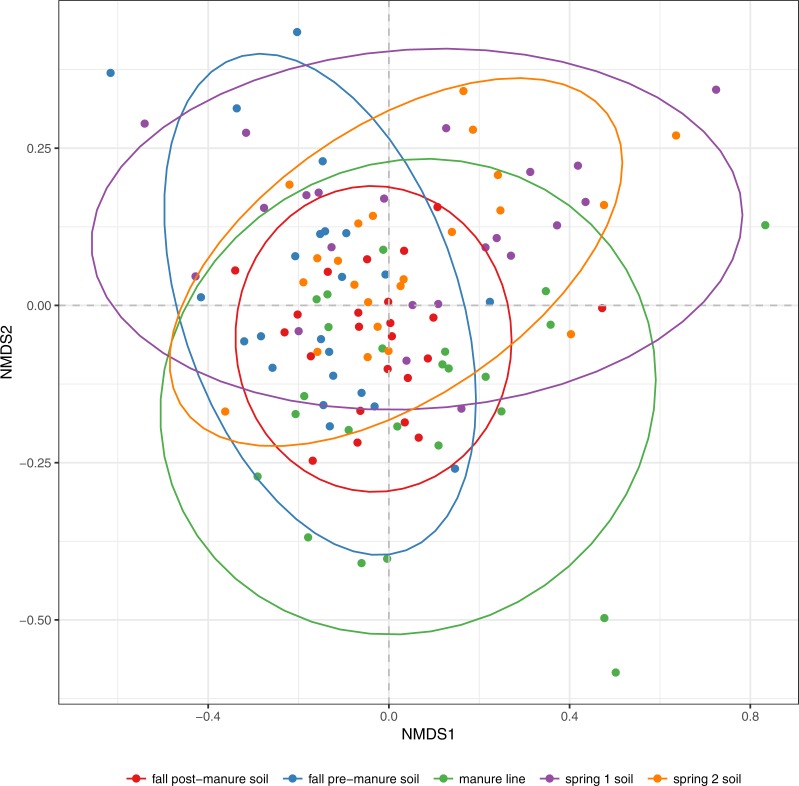
Fig 3. Comparison of community composition between soil and manure line samples.
Community composition varied significantly between all samples except between the spring samples. Spring time 1 and spring time 2 soil are combined as spring soil. Clustering is based on nonmetric multidimensional scaling analysis of samples according to Bray-Curtis distances. Manure was excluded from the NMDS plot to show variation of soil samples.

