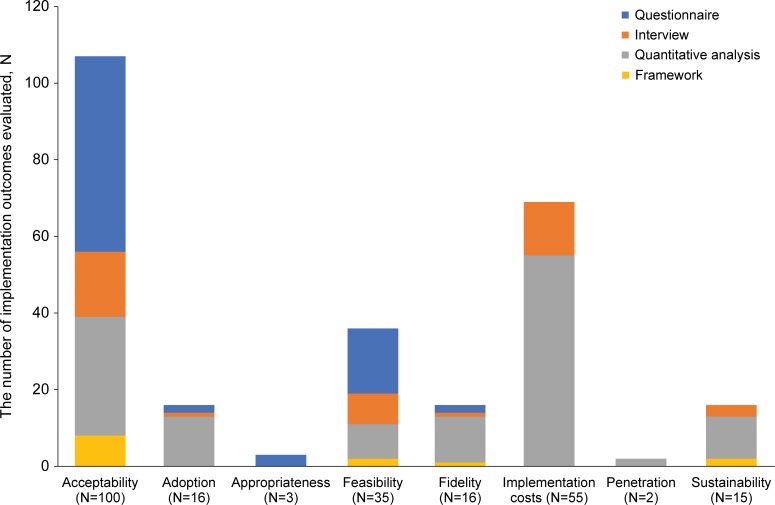
Fig 4. Distribution of methodologies for the evaluation of implementation (N = 242, n = 93) [28, 30, 31, 35, 36, 40, 42, 43, 45, 46, 48–51, 53–58, 60–64, 66–69, 71, 72, 74, 77–80, 83–94, 96, 97, 99–101, 103, 104, 106–109, 111–114, 116–145].
N represents the total number of implementation outcomes reported. n represents the number of publications in which these implementation outcomes are reported. †The numbers reported do not add up to the total number of reported implementation outcomes (N = 242) as multiple methods could be used to evaluate the implementation outcome.

