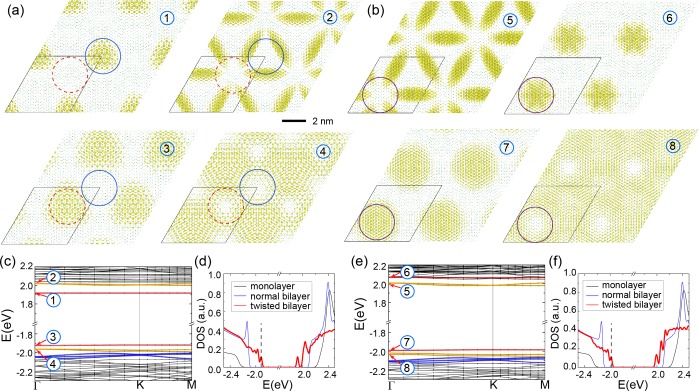
Figure 2.
Localization of electronic states in the flat bands of TBBN at 2.64°. (a,b) Top view of the charge density plot for the electronic states highlighted in the band structures shown in (c,e) for configurations α and β after relaxation, respectively. (d,f) The corresponding density of states of twisted bilayer hBN in the two configurations in comparison to those of monolayer and bilayer hBN without twist. The vertical dash lines in (d,f) indicate the zero of the chemical potential μ used in Figure 3c.

