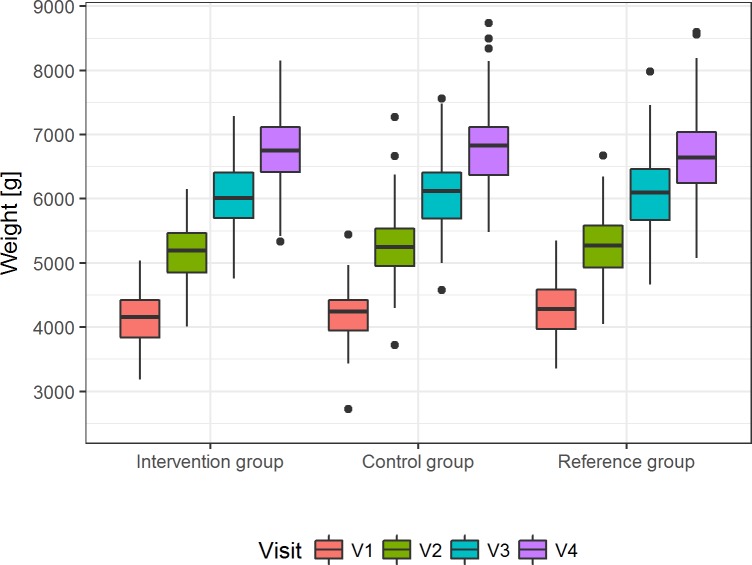
Fig 2. Weight gain in the three groups during the intervention period.
Presented are the unadjusted median weights [g] with 25th and 75th percentile, maximum and minimum for visits 1 to 4 in the per-protocol population (p = 0.5950 for least-squares means of weight at V4, S8 Table).

