
Fig 5. Effects of Malat1 on autophagy in macrophages.
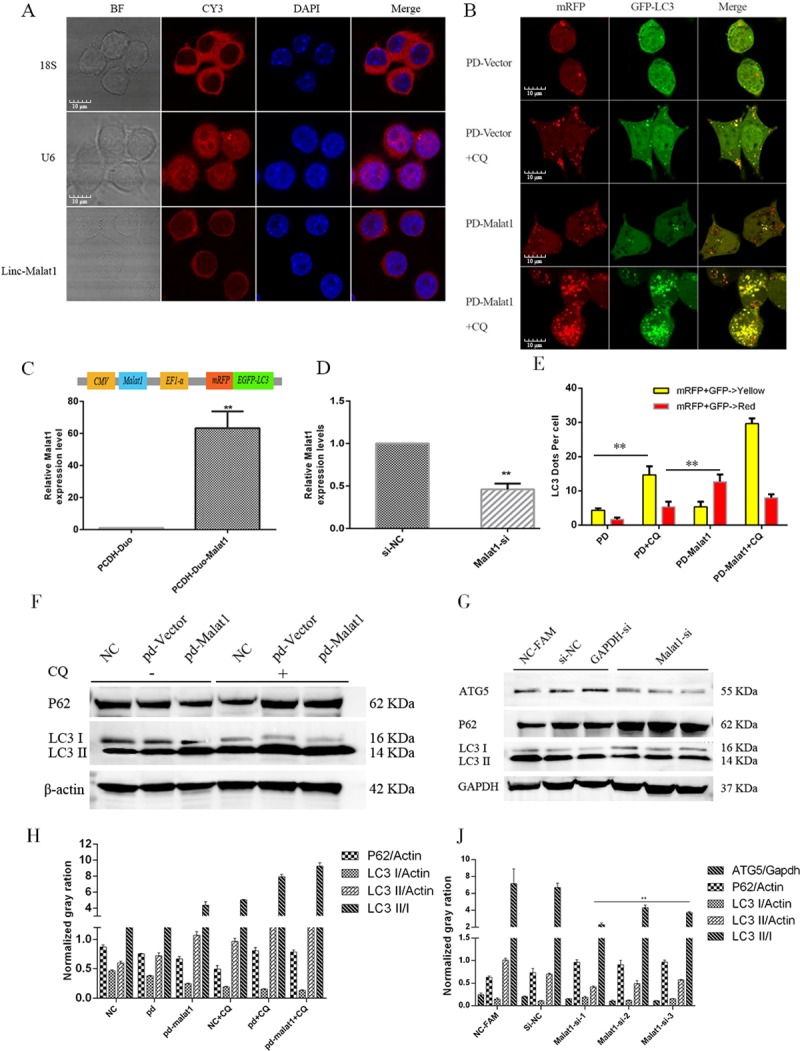
(A) RNA-FISH was performed to confirm sub cellular distribution of Malat1 in Raw264.7 cells (Scale bar = 10 μm, n = 3). (B) Confocal microscope was used to check the autophagy flux in different groups (Scale bar = 10 μm, n = 3). (C) The expression of Malat1 in Raw264.7 cells infected with PCDH-Duo-Malat1 (PD-Malat1) or vector (PCDH-Duo) Lentivirus was assessed by RT-qPCR (Mean±SD; n = 3). GAPDH was used as the endogenous control. (D) The expression of Malat1 was assessed by RT-qPCR in Raw264.7 cells transfected with Malat1-SiRNA and ASO mix (Mean±SD; n = 3). (E) Fluorescent LC3 dots per cell was quantified by Image J software, the data represent the Mean±SD of three independent experiments. (F and H) Autophagy marker P62 and LC3 were assessed by Western blot in PD-Vector or PD-Malat1 group. The expression of autophagy marker protein includes P62, LC3 was normalized against β-actin. (G and J) Autophagy marker P62, ATG5 and LC3 were assessed by Western blot in the Malat1-siRNA or Si-NC groups. The expression of autophagy marker protein includes ATG5, P62 and LC3 was normalized against GAPDH. *P<0.05 or ** P<0.01 in experiments vs. the corresponding control group.