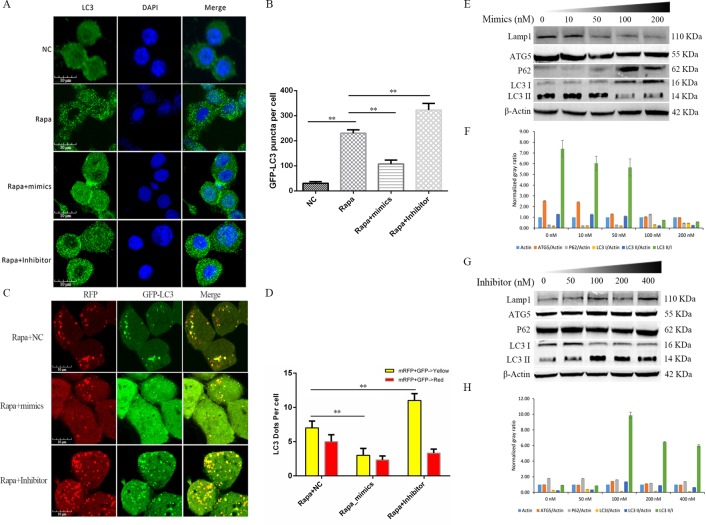
Fig 7. mir-23b-3p inhibits autophagy in macrophage.
(A) Immunofluorescence of endogenous LC3 was checked in Raw264.7 cells under different treatment conditions (Scale bar = 10 μm). (B) GFP-LC3 puncta per cell was quantified by Image J software, the data represent the Mean±SD of three independent experiments. (C) Autophagy flux analysis was conducted in Raw264.7 cells in Rapa+NC, Rapa+mimics, or Rapa + Inhibitor group to confirm mir-23-3p function (Scale bar = 10 μm). (D) Fluorescent LC3 dots per cell was quantified by Image J software, the data represent the Mean±SD of three independent experiments. (E-H) Western blot was used to detect the protein levels of Lamp1, ATG5, P62, LC3 I/II in Raw264.7 cells treated with concentration gradients of (E) mimics (0–200 nM) or (G) inhibitors (0–400 nM). Normalized gray ratio was also compared, the expression of protein was normalized against β-actin (Mean±SD; n = 3).

