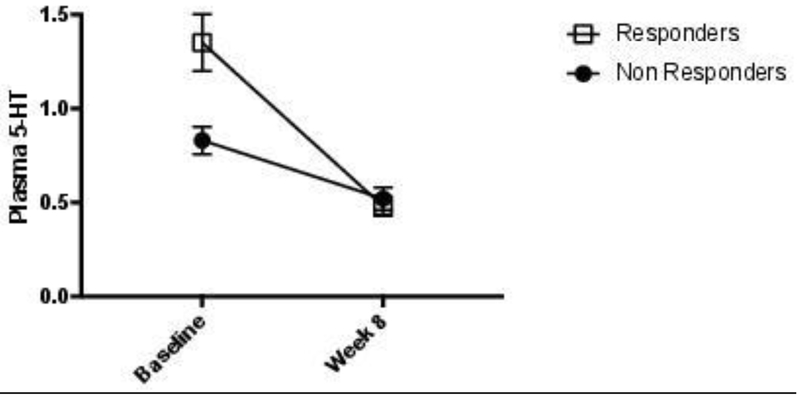
Figure 1.

Mean (SEM) plasma 5-HT levels in responders and non-responders at baseline and at week 8. Baseline 5-HT levels were significantly different between responders and non-responders (p<0.05), and the decrease in 5-HT was significantly greater in responders than in non-responders (p<0.05).
