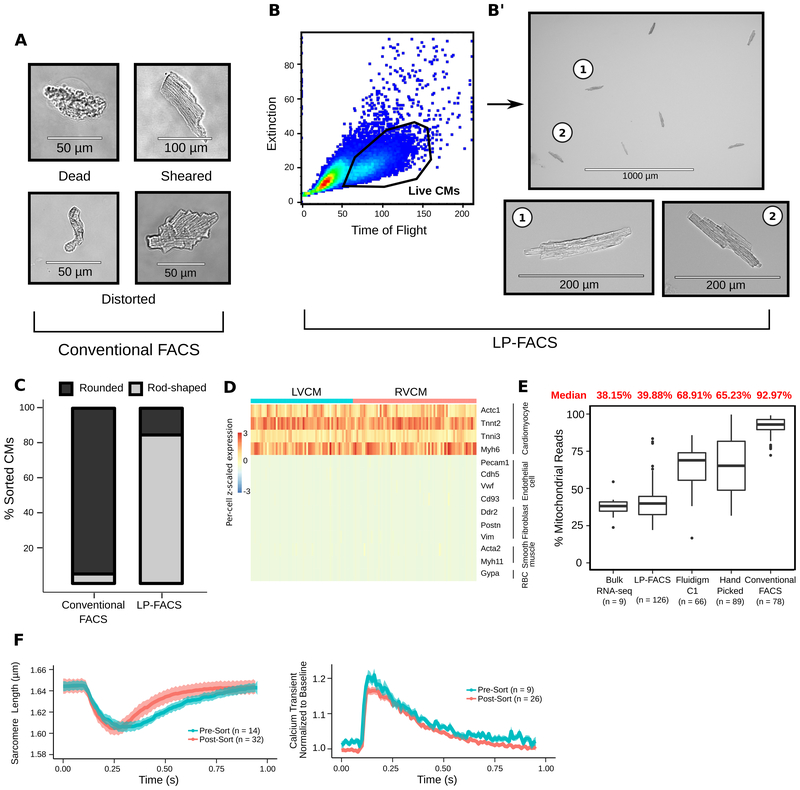
(A) CM images obtained from conventional FACS, representing the vast majority of sorted cells. (B) CM isolation through LP-FACS. (C) % rod-shaped CMs from conventional FACS vs LP-FACS. 200–400 CMs were analyzed per sorting approach. (D) Heatmap of genes representing cardiac cell types. LVCM, left ventricular CM; RVCM, right ventricular CM. (E) Comparison of % mitochondrial reads resulting from methods indicated. (F) Sarcomere shortening (left) and calcium transient (right) traces for pre- and post-sorted CMs. Dark lines/shaded areas represent mean/standard error, respectively.

An official website of the United States government
Here's how you know
Official websites use .gov
A
.gov website belongs to an official
government organization in the United States.
Secure .gov websites use HTTPS
A lock (
) or https:// means you've safely
connected to the .gov website. Share sensitive
information only on official, secure websites.
