Figure 5.
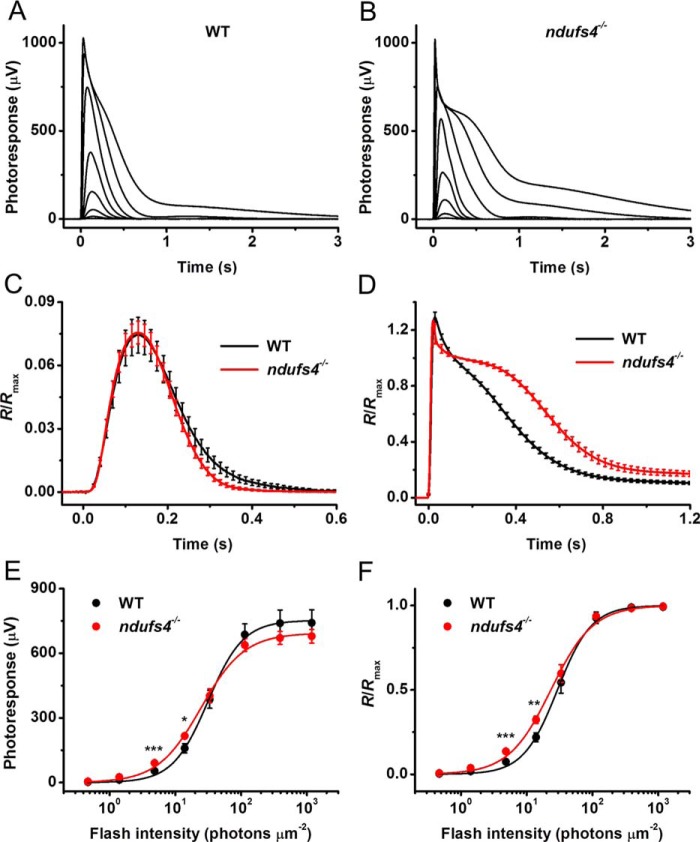
Normal rod light responses in isolated ndufs4−/− retinas. A, representative family of rod responses from isolated WT mouse retina. Test flashes of 505-nm light with intensities of 0.5, 1.4, 4.8, 14, 33, 114, 392, and 1188 photons μm−2 were delivered at time 0. B, representative family of rod responses from isolated ndufs4−/− mouse retina. Test flashes of 505-nm light had the same intensities as in A. C, kinetics of rod phototransduction activation and inactivation in control and ndufs4−/− mice. Population-averaged dim-flash responses to test stimuli of 4.8 photons μm−2 (n = 8 for controls and n = 10 for mutants) were normalized to Rmax of respective retinas. D, comparison of saturated rod responses from WT and ndufs4−/− mice. Population-averaged responses to test stimuli of 1188 photons μm−2 (n = 8 for controls and n = 10 for mutants) were normalized to Rmax of respective retinas. E, averaged rod intensity–response functions for WT (n = 8) and ndufs4−/− (n = 10) retinas. Points were fitted with hyperbolic Naka–Rushton functions as described under “Experimental procedures.” F, normalized averaged rod intensity–response relationships for control (n = 8) and ndufs4−/− (n = 10) retinas. Naka–Rushton fits yielded I0.5 values of 29 and 23 photons μm−2 for WT and ndufs4−/− mice, respectively. The statistical significance of the data in E and F is represented as follows: *, p < 0.05; **, p < 0.01; ***, p < 0.001. All recordings were from P41 control and ndufs4−/− mice. Error bars represent S.E. in all panels.

