Figure 5.

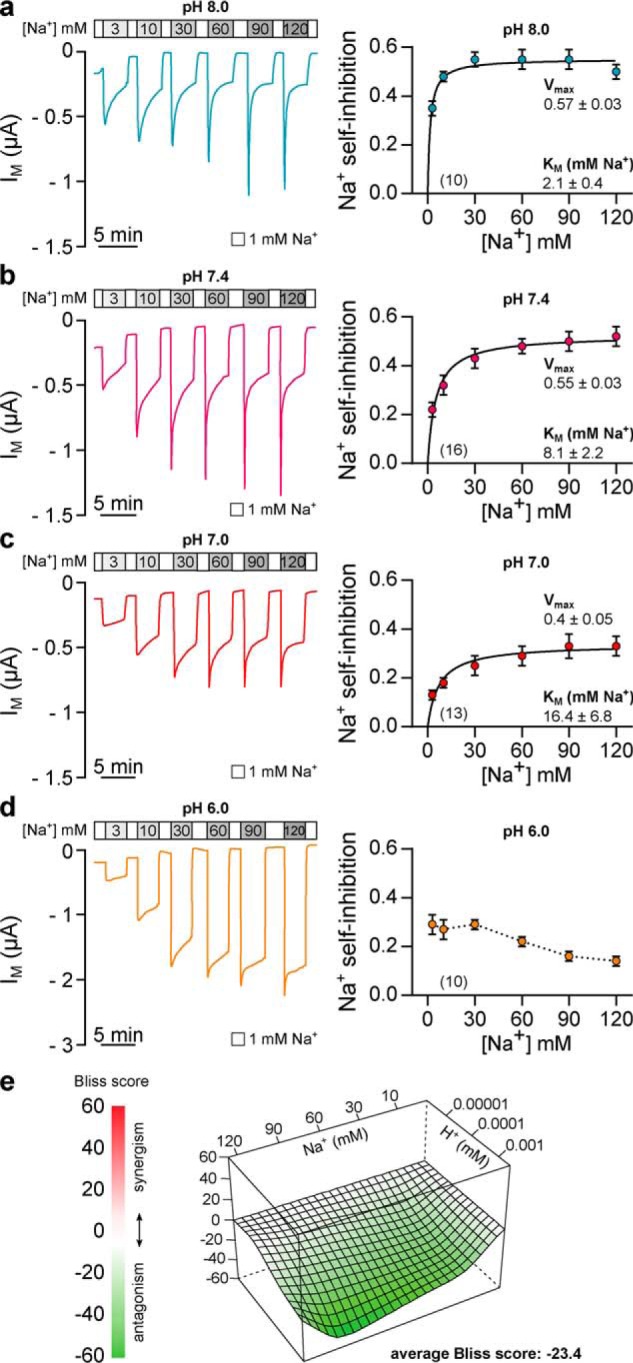
Extracellular acidification antagonizes sodium self-inhibition of Xenopus δβγ-ENaC. a, representative recording of IM in oocytes expressing Xenopus δβγ-ENaC. SSI was determined by rapidly changing extracellular [Na+] from 1 to 3–120 mm at pH 8.0. The magnitude of Na+ self-inhibition ((IM, peak − IM, 3 min)/IM, peak) was plotted against the respective [Na+] and fitted to the Michaelis-Menten equation, allowing estimation of maximal inhibition (Vmax) and apparent affinity for Na+ (Km). b–d, current recordings and Michaelis-Menten plots of SSI in Xenopus δβγ-ENaC at pH 7.4, 7.0, and 6.0. At pH 8.0, Vmax of SSI is similar to values at pH 7.4 (b), but SSI displays an enhanced Na+ affinity (Kruskal-Wallis test, p = 0.035; Dunn's multiple comparisons test). Compared with values at pH 7.4, further acidification (pH 7.0, c) decreases Vmax (one-way ANOVA, F = 5.508, Tukey's multiple comparisons test, p = 0.017), whereas the apparent Na+ affinity of SSI is not significantly changed (Kruskal-Wallis test, Dunn's multiple comparisons test, p > 0.999). Irrespective of the extracellular [Na+], SSI of Xenopus δβγ-ENaC is markedly reduced at pH 6.0 (d) and does not converge to a Michaelis-Menten fit. e, interaction landscape for Na+-dependent SSI at different extracellular H+. The Bliss score indicates deviations of the measured combinational responses from a reference model that assumes independence between Na+- and H+-mediated responses. Negative Bliss values across the interaction landscape indicate antagonism of Na+ dependent SSI by increasing H+.
