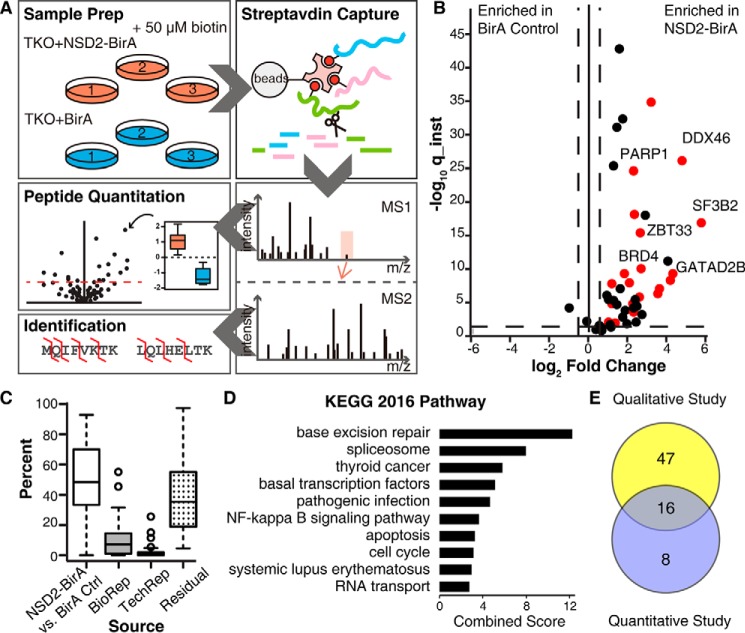
Figure 2.
NSD2-binding partners identified by label-free quantitative MS. A, study design: three biological replicates of TKO cells stably expressing NSD2-BirA or nuclear-localized BirA control were cultured with biotin, lysed, and quantified. Equal amounts of total protein from each sample was used for streptavidin capture and trypsin digestion. The resulting peptides were purified and analyzed by nanocapillary LC-MS in triplicate. High resolution MS1 was used for relative peptide quantification and MS2 was used for protein identification. B, volcano plot of quantified proteins is shown. The x axis is the fold-change in protein abundance of NSD2-BirA relative to BirA control. The y axis (instantaneous q-value) measures the statistical confidence of the variation between NSD2-BirA and BirA control. The vertical dotted lines represent a 2-fold change threshold. The horizontal dotted line indicates a false discovery rate of 5%. Twenty-four nuclear targets above threshold are colored red. C, box and whisker plot indicating variations in signal intensity of each quantified protein. Variation attributed to the treatment (NSD2-BirA versus BirA control), biological replicates, technical replicates, or residuals (variation not explained by any of the previously described sources) are indicated. D, gene ontology KEGG pathway analysis of the 24 high confidence NSD2 partners. E, Venn diagram of overlapping hits from the BioID IP-MS qualitative Study 1 (see Fig. 1) and label-free quantitative Study 2.

