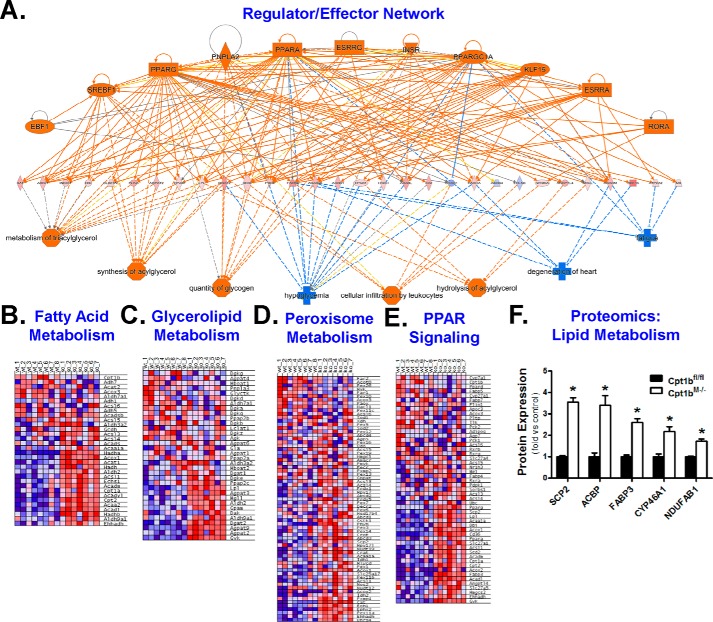
Figure 2.
Cpt1bM−/− mice substantially remodel lipid handling pathways. IPA of SAGE data was used to develop a global regulator/effector network (A). GSEA was used to generate heatmaps showing that Cpt1bM−/− (KO; n = 7) mice exhibit up-regulation (red) of pathways involved in fatty acid metabolism (B), glycerolipid metabolism (C), peroxisome metabolism (D), and PPAR signaling (E) versus Cpt1bfl/fl (WT; n = 8) littermate controls. Peptides related to lipid metabolism were also identified in the proteomics analysis (F). *, p < 0.05. The following key for regulator/effector network is as follows: regulators (top); effectors (bottom); genes (middle); orange (activation/up-regulation); blue (inhibition/down-regulation); solid lines (direct relationship); dashed lines (indirect relationship); ellipse (transcription factor); rectangle (ligand-dependent nuclear receptor); diamond (enzyme); triangle (kinase); trapezoid (transporter); octagon (function); plus (disease).

