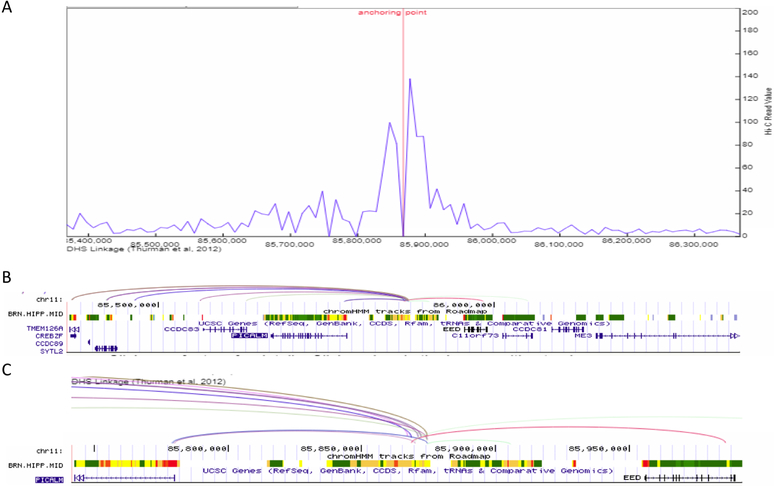
Figure 3.
Enhancer-promoter interaction plot for the >1Mb defined PICALM LOAD-GWAS region, tagged by SNP rs10792832. (A) Line plot of the interaction frequency for Hi-C reads in the hippocampus, anchoring point at chr11:85,867,400 (5’ end of enhancer). (B) gene structure and chromHMM track for brain hippocampus middle to show the location of genomic structures including active enhancers (orange), transcription (green) and the transcription start site (red). Proximate active enhancer (type 9) was defined at chr11:85,867,400–85,867,800 (400 bp), 75bp from the tagging SNP rs10792832 (chr11:85,867,875). Arcs show interactions between the defined enhancer and promoters (Pearson correlation coefficient ≥ 0.7 between enhancer and promoter) in the target genes based on DNase I hypersensitive site (DHS)-linkage data. All arcs involving the same proximal DHS are drawn with the same color. (C) Inset shows a magnified version of the arcs and ChromHMM for an approximately 200Kb subset of the full genomic region. The inset shows the origin of the arcs in the enhancer.

