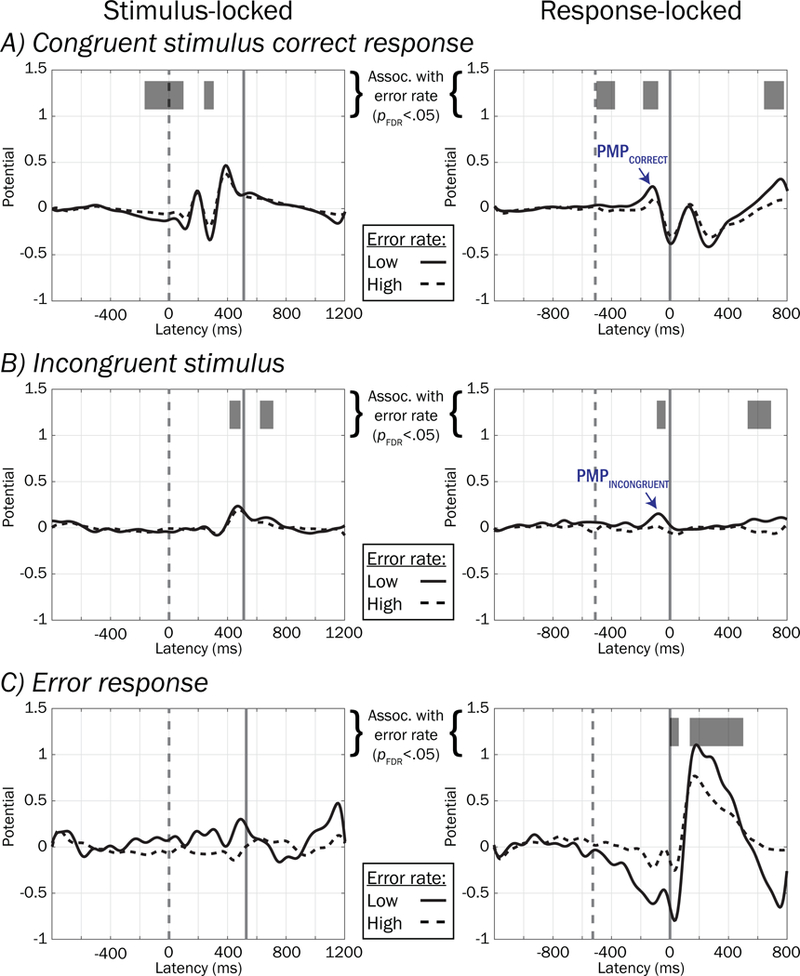
Figure 12.

Between-subject voltage associations with error rates using factored rERPs. Waveforms depicting group averaged factored rERPs within high (dashed traces) and low (solid traces) error rates split by terciles are plotted for illustration. Periods of the factored rERPs are highlighted in greyscale to show regions where there was significant association (pFDR < .05 for more than 50 contiguous ms) between rERP and error rate.
