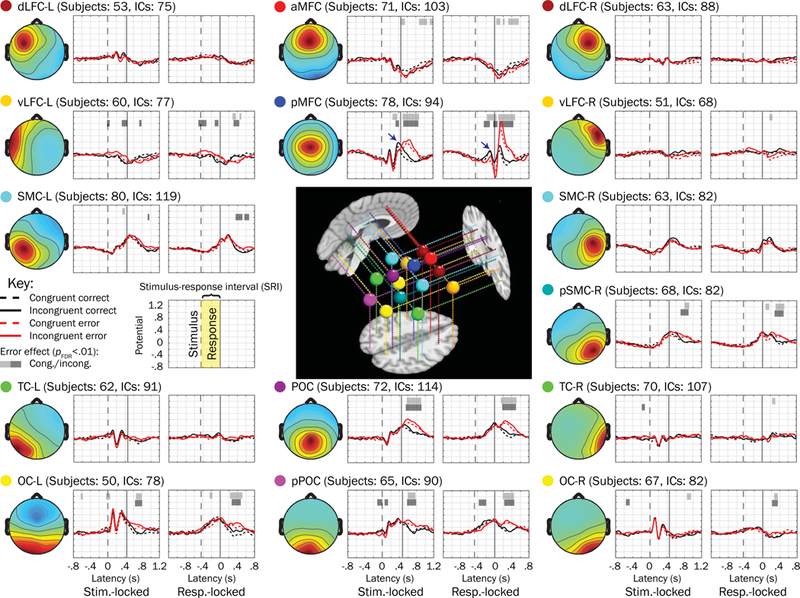
Figure 4.

Fifteen source clusters, grand mean trial waveforms, and voltage associations with errors. Grand mean waveforms from error (red traces) and correct (black traces) performance trials (matched within stimulus congruency types [congruent = dashed, incongruent = solid] by response time) are plotted next to mean scalp topographies for each of 15 source clusters (one of the clusters not shown because it primarily reflected ocular activity) examined in the present study. Horizontal bars plotted above waveforms indicate regions where the mixed model logistic regressions showed voltage to be significantly associated with errors (having pFDR < .01 for more than 50 consecutive ms); light shaded bars correspond to congruent trials whereas dark bars correspond to incongruent trials. We looked for significant associations within the mean stimulus-response interval (SRI, labeled in the key). Mean dipoles for each of these clusters are plotted in the center on representative sagittal, axial, and coronal slices from the template brain. Abbreviations: dLFC = dorsolateral frontal cortex; MFC = medial frontal cortex; vLFC = ventrolateral frontal cortex; SMC = sensorimotor cortex; TC = temporal cortex; POC = parietooccipital cortex; OC = occipital cortex; the prefixes “a” and “p” refer to “anterior” and “posterior” (respectively) and suffixes “-L” and “-R” correspond to left and right hemispheres.
