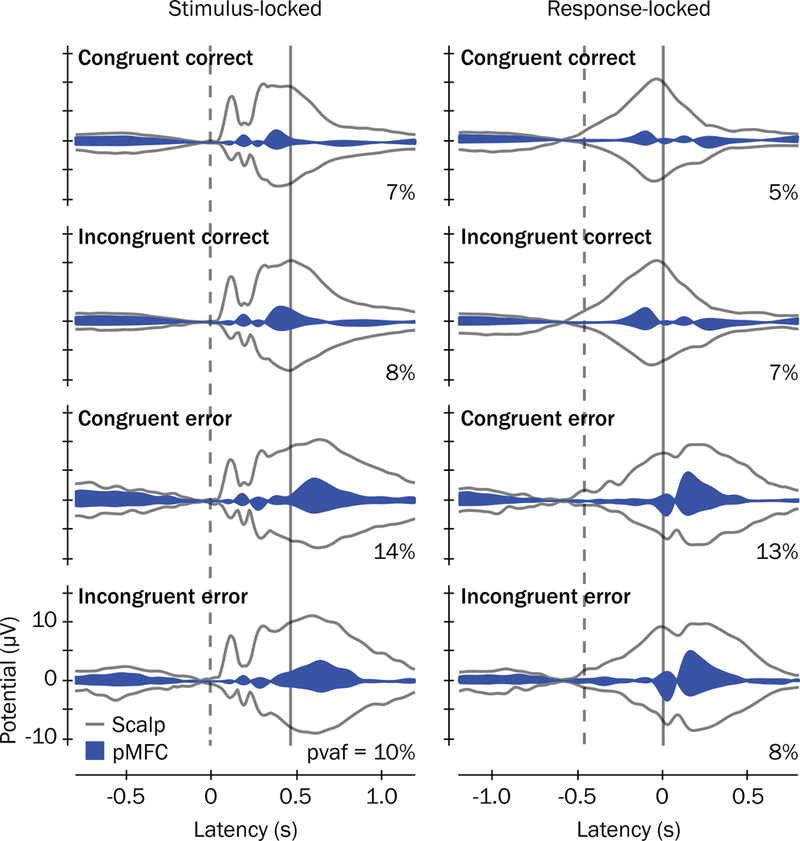
Figure 6.

ERP envelopes and contributions of the pMFC cluster to scalp potentials. ERP envelopes (outer gray traces) show the maximum and minimum scalp channel voltages for each latency in the grand mean ERP waveforms, time-locked to stimulus presentations (left) and button responses (right). Grand mean latencies for stimulus presentations and button responses are denoted with vertical dashed and solid lines, respectively. Contributions of the pMFC source cluster to the grand mean ERPs are shown as blue envelopes and the percent variance accounted for ( ) by pMFC to each ERP envelope are reported.
