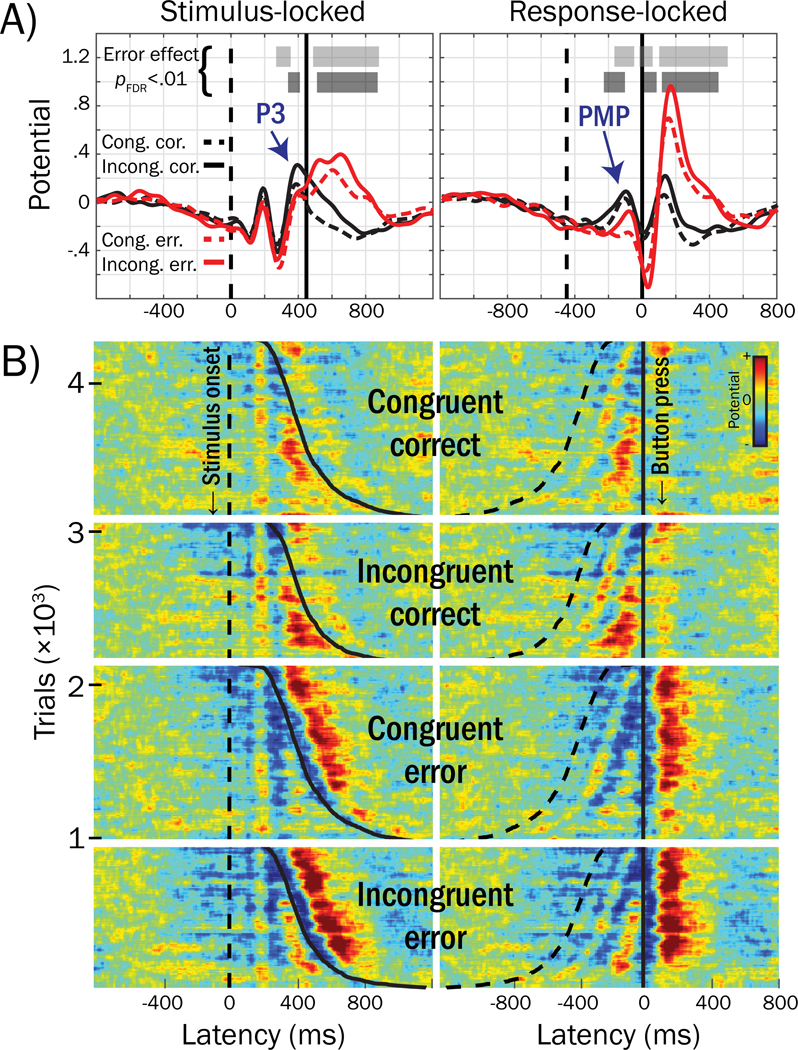
Figure 7.

Grand mean waveforms from response-time-matched error and correct trials for the pMFC cluster activities and trial-level ERP-images. A) Voltage peaks within the mean stimulus-response interval (SRI, i.e., between the vertical dashed [stimulus] and solid [response] lines) that were associated with errors in trial-level logistic regressions are labeled: Frontocentral P3 and Pre-Movement Positivity (PMP). B) ERP-images for response-time-matched error and correct trials, across subjects. Stimulus- and response-locked ERP-images are labeled, reflecting time-varying voltage (referenced and scaled to baseline, see text) for each trial stacked and sorted by stimulus congruency (congruent, incongruent), response accuracy (error, correct), and response time (dashed line = stimulus onset, solid line = button press); red colors reflect positive voltage deflections and blues reflect negative voltage deflections (root mean square normalized within subject) forward-projected to channel Cz. Trials in ERP-images are grouped by congruent correct (n = 1,153), incongruent correct (n = 945), congruent error (n = 1,153) and incongruent error (n = 945). For example, the first row in the first group of trials corresponds to a correctly-performed congruent trial drawn from the subject with the fastest RT across all subjects; the last row in the first group of trials corresponds to a correctly-performed congruent trial from the subject with the slowest RT across all subjects. For ease of visualization, ERP images were smoothed vertically using a sliding boxcar window of 1% width the overall number of trials (n = 4,196).
