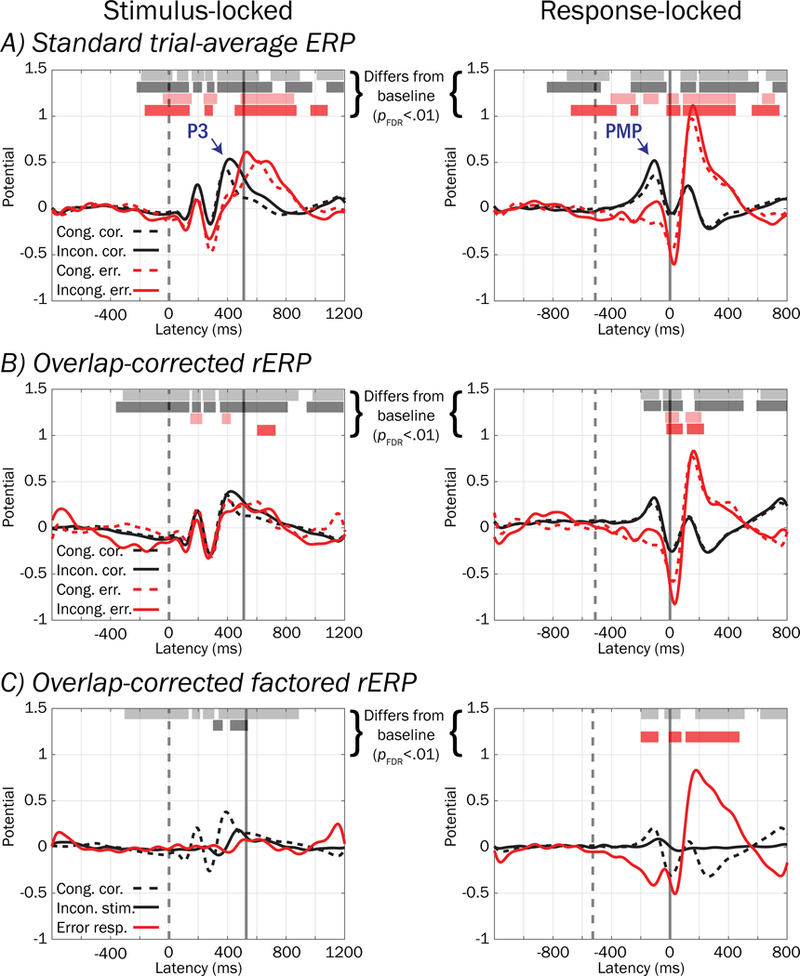
Figure 9.

Standard ERPs, overlap-corrected rERPs, and overlap-corrected factored rERPs from the pMFC cluster. A) Standard trial-averaged stimulus- (left) and response-locked (right) ERPs, time-varying voltage of relatively consistent polarity at one or more latencies across trials (scaled to a pre-stimulus baseline period, see text) for each stimulus (congruent stimuli = dashed traces; incongruent = solid traces) and response type (correct = black; error = red). B) Overlap-corrected regression ERPs (rERPs, described in text) can be similarly interpreted to standard ERPs, although unlike standard ERPs that confound stimulus- and response-locked potentials occurring in the same time window, rERPs provide an estimate of what stimulus- and response-locked ERP processes separately contribute via summation to the time-overlapped standard ERP. C) Overlap-corrected, factored rERPs show the potential on congruent correct-performance trials (black dashed trace), 2) deviation when flanking stimuli are incongruent with the target stimulus (black solid trace), and 3) deviation associated with erroneous responses (red trace). The mean value within a pre-stimulus baseline interval was subtracted from all waveforms. Vertical dashed and solid lines denote mean stimulus and response latencies respectively.
