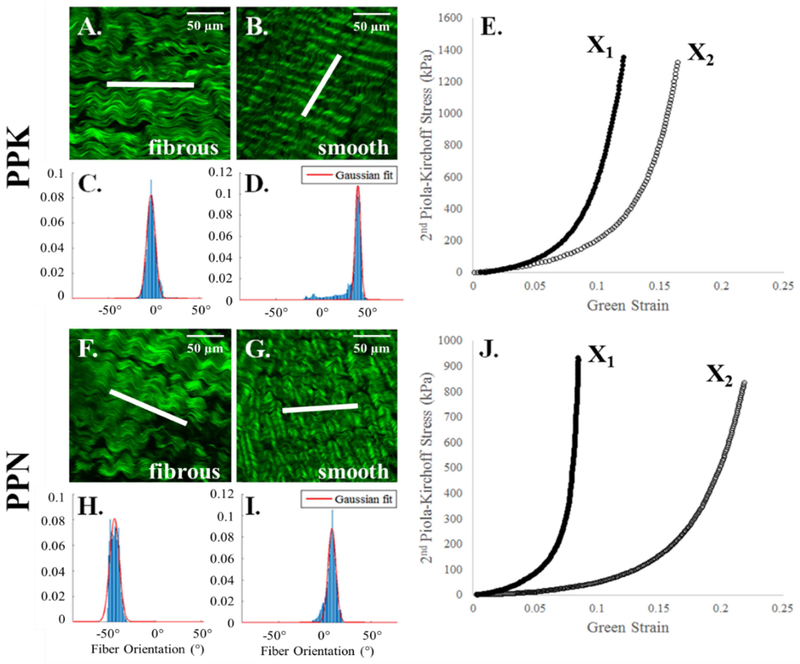
Figure 1.
Representative multiphoton microscopy images and fiber distribution graphs of collagen fibers on the smooth and fibrous sides of PPK (A-E) and PPN (F-J) samples with their respective equibiaxial response. Scale bar shows 50 μm (A, B, F, G, top right). The white line in the center of each image depicts the measured average fiber orientation. The red line depicts the Gaussian fit to the collagen fiber distribution, plotted as probability density vs. fiber orientation (degrees). Fiber orientation values of 0° and ±90° (relative to the horizontal) correspond to alignment with the X1 and X2 axes, respectively.

