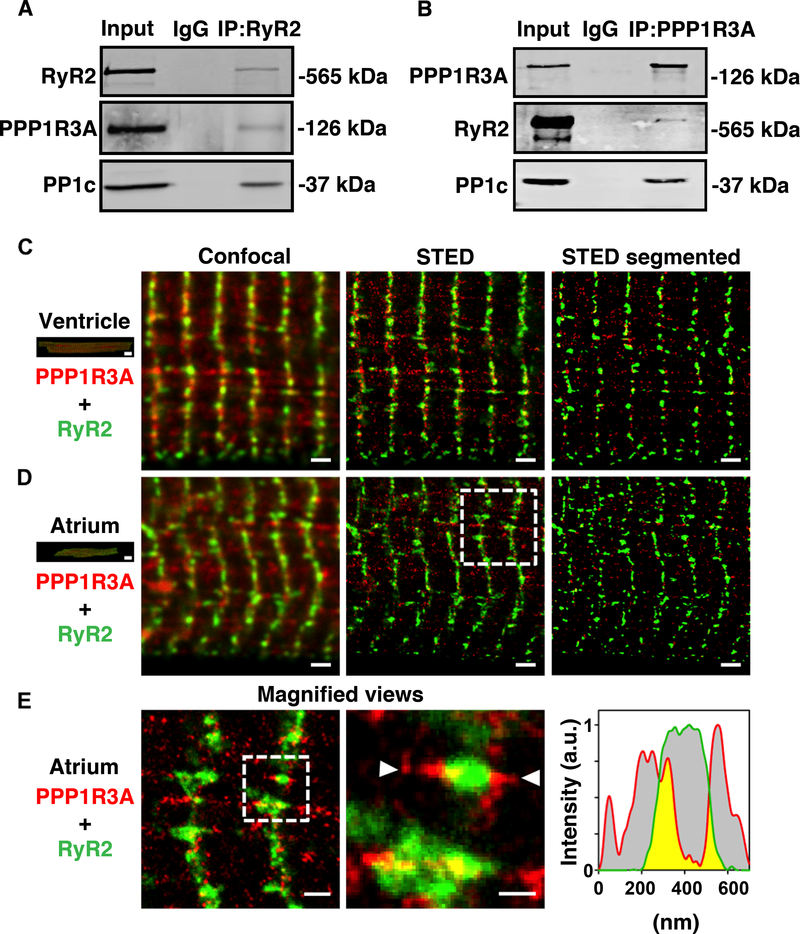
Figure 1. Validation of binding between RyR2, PPP1R3A and PP1c in mouse heart.
Representative Western blots confirming the interaction between RyR2, PPP1R3A, and PP1c in WT mouse heart lysates immunoprecipitated with (A) RyR2 antibody or (B) PPP1R3A antibody. Confocal and STED imaging of co-immunostained ventricular (C) and atrial (D) mouse cardiomyocytes. STED, but not confocal imaging, resolves the PPP1R3A (red) and RyR2 (green) signals, which enables image segmentation for regional nanodomain visualization (right). Of note, RyR2 and PPP1R3A clusters show considerable differences in their subcellular distribution between ventricular and atrial myocytes. Scale bars 10 μm (left, cell overview) or 1 μm (image panels). (E) Left: Magnified view (as indicated in D). Center: zoom-in showing the local association of PPP1R3A with RyR2 clusters at nanometric scale. The white triangles indicate the nanodomain orientation used for signal intensity profiling. Right: The PPP1R3A (red) and RyR2 (green) signal distribution confirms sub-cluster areas exhibiting co-localized signals (yellow). Scale bars 500 nm (left) or 200 nm (center). Dashed boxes indicate magnified views in (D) and (E).

