
FIGURE 4.
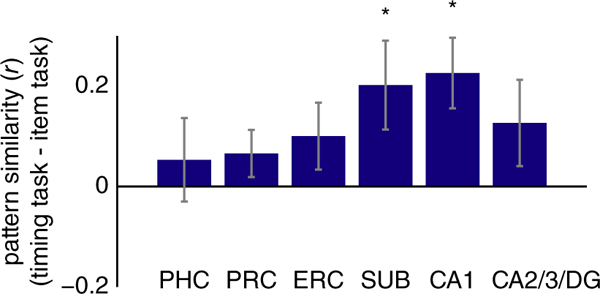
Multivariate pattern similarity for the timing task. Pearson correlation between activity patterns in each ROI for odd versus even runs of the timing task, relative to the correlation between activity patterns for the item task. Subiculum [SUB] and CA1 showed greater pattern similarity for temporal attention versus item attention. Error bars reflect ±1SEM across subjects. * p < 0.05 [Color figure can be viewed at wileyonlinelibrary.com]