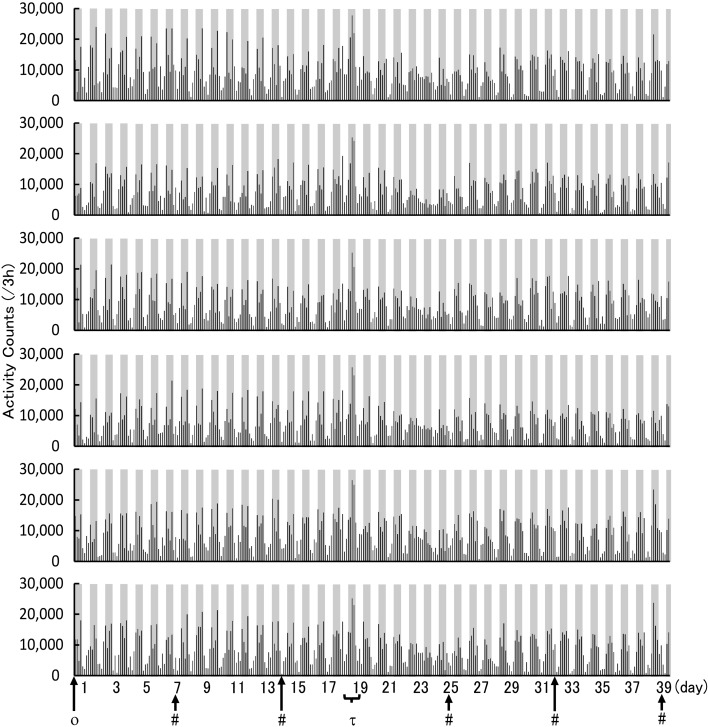
Fig. 1.
Continuous activity counts for each rat during the convalescence and acclimation periods. Locomotor activity every 3 h. Dark-filled and non-filled areas in the graphs indicate the dark and light phases, respectively. The cross axle indicates the day after the operation. Each point is shown as ο: operation; #: cage exchange; τ: transportation.

