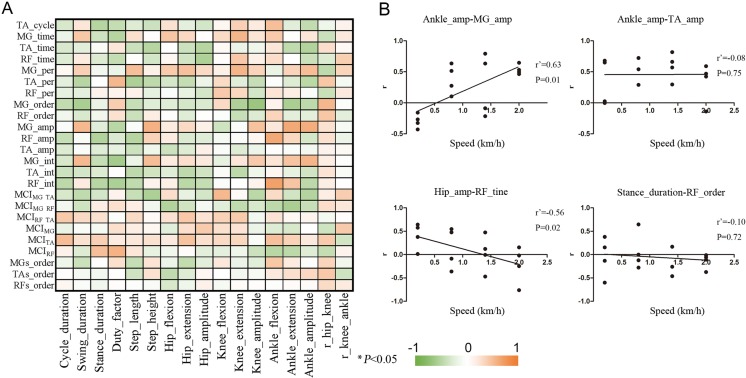
Fig. 3.
Correlation between the speed and the r values of the correlation between kinematic and EMG parameters at each speed. (A) Matrix of the linear correlations between the speed and the r values of the correlation between kinematic and EMG parameters at each speed. The bar represents the correlation coefficients of the correlation between speeds and the r values of the correlation between kinematic parameters and EMG parameters. *P<0.05. (B) Linear regression plots demonstrating the correlation between speeds and the correlation coefficients between the kinematic parameters and EMG parameters. Dots represent individual values (n=4 monkeys). Abbreviations are the same as Fig. 2.

