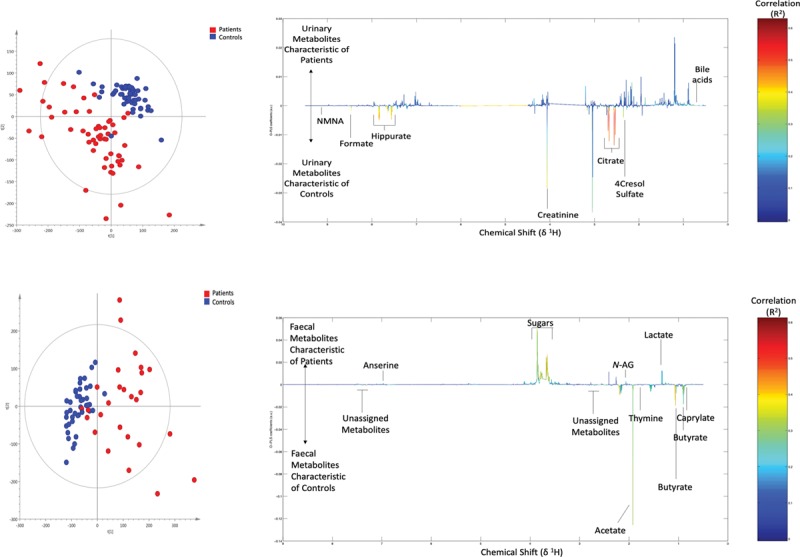
Figure 1.

Urinary and fecal 1H-nuclear magnetic resonance (1H-NMR) global metabolic profiles of critically ill and healthy children. A, Unsupervised principal components analysis (PCA) scores plot of admission urine samples from age-matched critically ill (red) and healthy (blue) children. R2 = 0.16, Q2 = 0.09. B, Supervised Orthogonal Projections to Latent Structures Discriminant Analysis (O-PLS-DA) loadings line plot. Urinary metabolites higher in critically ill children (up) compared with age-matched healthy children (down). The color bar indicates the correlation coefficient (R2) (i.e., the redder the peak, the higher the correlation). R2Y = 0.89, Q2Y = 0.80. C, Unsupervised PCA scores plot of fecal samples from age-matched critically ill (red, n = 27) and healthy control (blue, n = 41) samples. R2 = 0.23, Q2 = 0.08. D, Supervised O-PLS-DA loadings line plot. Fecal metabolites higher in critically ill children (up) compared with age-matched healthy children (down). R2Y = 0.96, Q2Y = 0.85. R2Y = variance explained, Q2Y= predictive ability. a.u = arbitrary units, N-AG = n-acetylglucosamine, NMNA = n-nethylnicotinamide.
