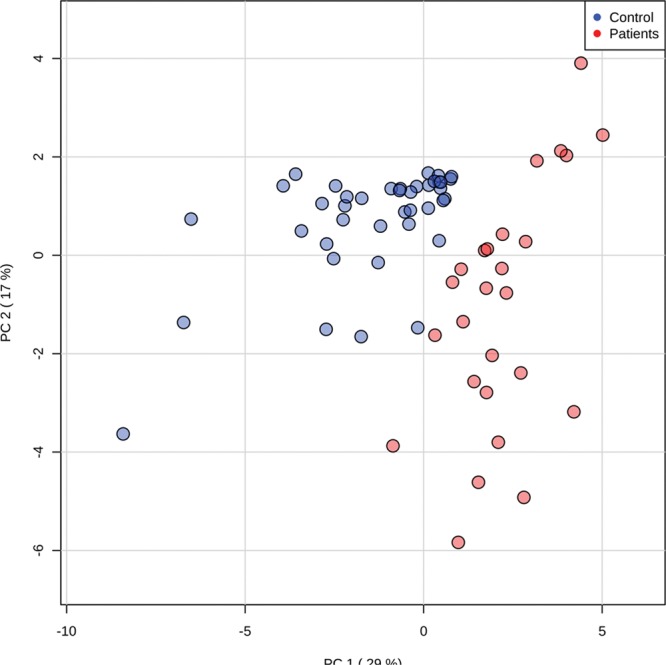
Figure 2.

Fecal liquid chromatography-mass spectrometry bile acid (BA) profiles of critically ill and healthy children. A, Unsupervised principal components analysis scores plot of critically ill (red) and healthy control (blue) samples. R2 = 0.47, Q2 = 0.16. B, Changes in the metabolism of BAs in critically ill (in red) compared with healthy children (in blue) illustrate accumulation of primary BAs and a reduction in lithocholic acid in critically ill children. 5β-CA-3β, 12a-diol = 5β-cholanic acid-3β, 12a-diol, FDR 2.952E-6, 23 nor 5β- CA-3α, 12a-diol = 23-nor-5b-cholanic acid-3a, 12a-diol, FDR 1.664E-7, 3KCA = 3 ketocholanic acid, FDR 3.505E-7, 3a-H-12 KLCA = 3a-hydroxy-12 ketolithocholic acid, FDR 4.174E-6, CA = cholic acid, FDR 2.142E-7, DCA = deoxycholic acid, FDR 0.004, FDR = false discovery rate, ILCA = isolithocholic acid, FDR 1.596E-10, LCA = lithocholic acid, FDR 6.157E-10, PC = principal component, TCA = taurocholic acid, FDR 0.001.
