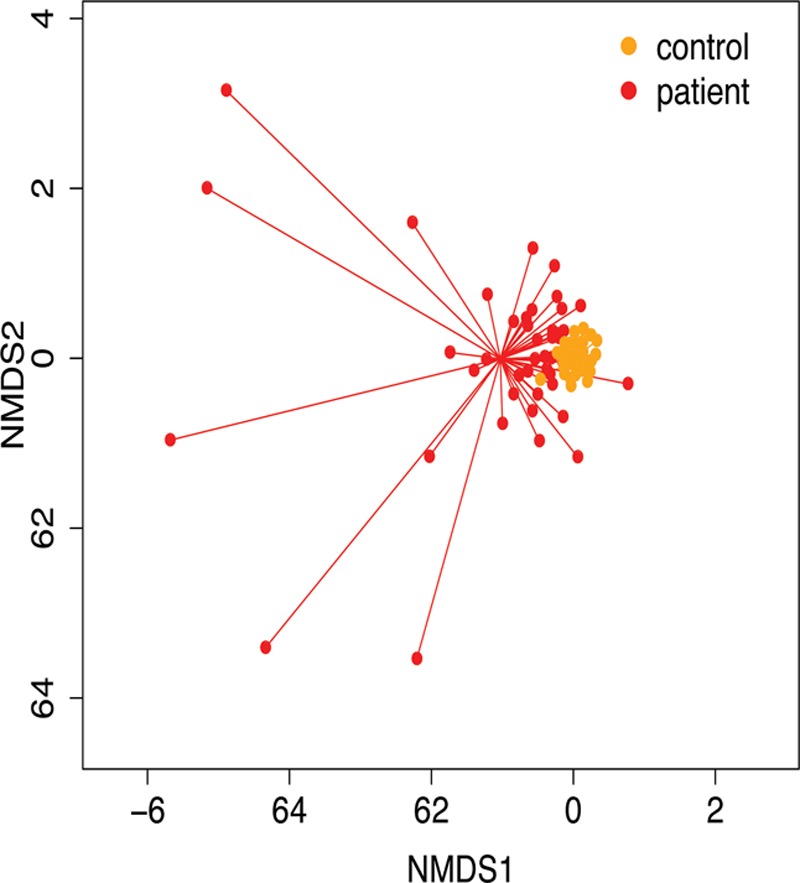
Figure 3.

Bacterial composition in age-matched critically ill and healthy children. Nonmetric multidimensional scaling (NMDS) plot of fecal microbial composition at genus level. High variability is seen in samples from critically ill children (red) compared with healthy controls (orange). PERmutational Multivariate ANalysis Of Variance (PERMANOVA) p = 0.0001, F = 3.314. Samples from healthy children were tightly clustered together, suggesting greater similarity in composition, while those from patients were scattered widely across the plot and statistically separated from the healthy profiles (PERMANOVA test: F = 9.78; p < 0.001).
