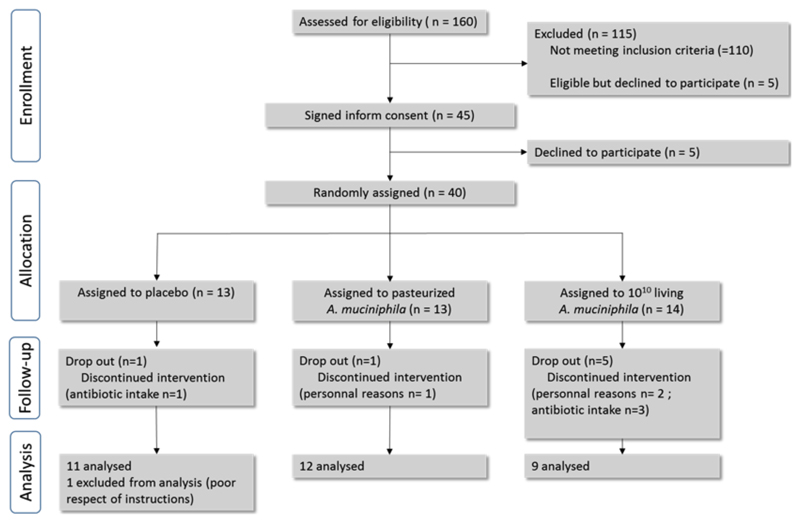
Extended data figure 1. Flow chart of the interventional study.
Diagram of the participant selection procedure, with the following information: number of individuals enrolled at each step of the study progress; number of individuals included in the final analysis; details of events that led to a reduction in the group size.

