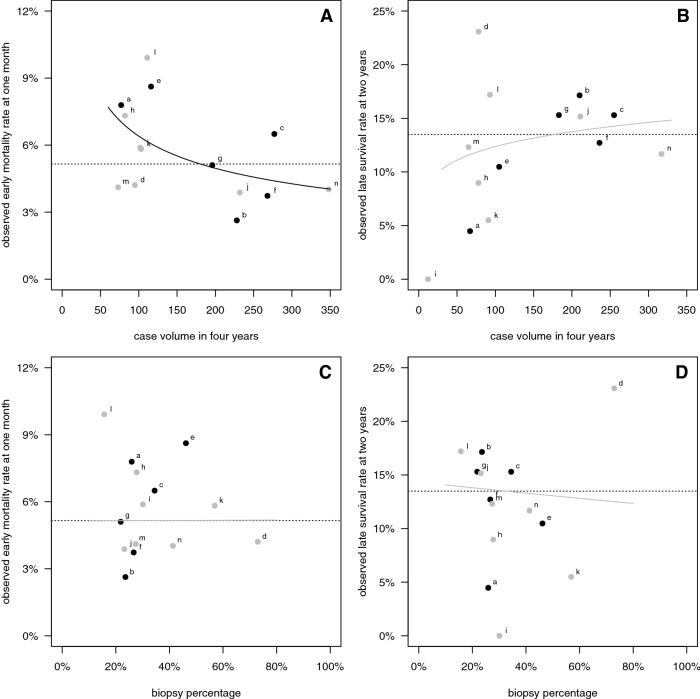
Fig. 2.
Hospital characteristics versus survival outcome. Plots of a case volume in 4 years versus observed early mortality percentage, b volume versus observed late survival percentage, c biopsy percentage versus observed early mortality percentage, and d biopsy percentage versus observed late survival percentage. Black circles indicate hospitals with an academic setting. The overall outcome percentages are represented by dotted lines. Logistic regression lines are drawn, significant association estimates in black, non-significant estimates in grey

