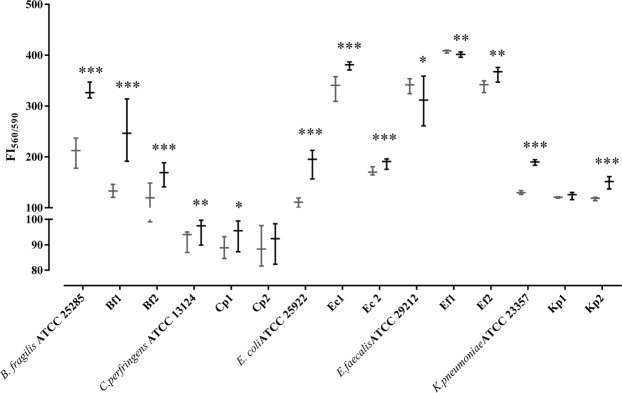
Figure 1.
Impact of lyso-Gb3 on monospecies biofilm formation. Fluorescence intensity (FI) (x1000) of each bacterial-strain biofilm in presence (black) or absence (gray) of lyso-Gb3. The following represent strains derived from clinical isolates (Table 1): E. faecalis (Ef1, Ef2), E. coli (Ec1, Ec2), K. pneumoniae (Kp1, Kp2), B. fragilis (Bf1, Bf2), and C. perfringens (Cp1, Cp2). The whiskers represent the interquartile range. *p-value < 0.05, **p-value < 0.01, and ***p-value < 0.001 for Wilcoxon signed-rank test.

