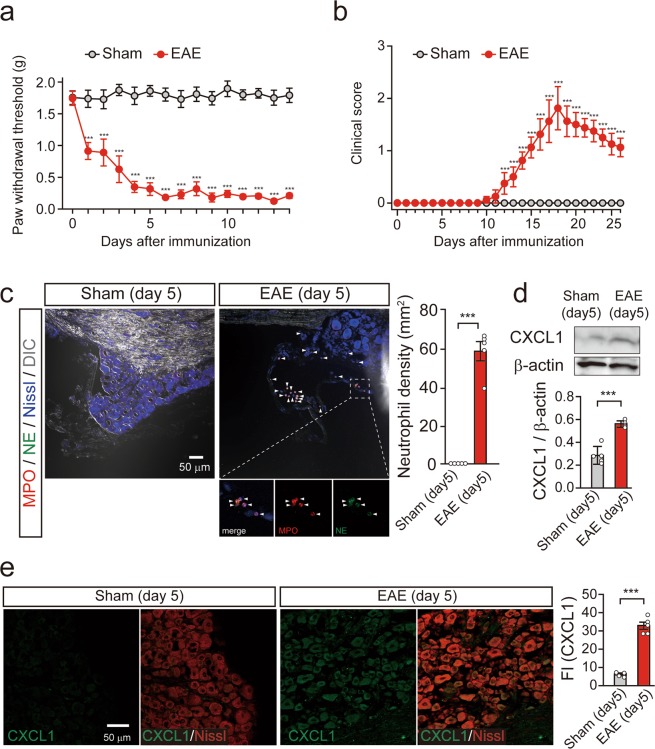
Figure 1.
CXCL1 is upregulated in mouse DRG neurons after MOG35–55 immunization. (a,b) Time course of mechanical allodynia (a) and clinical score (b) in MOG35–55-immunized mice. n = 8 mice per group, two-way repeated measures ANOVA, F(1, 210) MOG35–55 treatment = 1145, ***P < 0.001 in (a); n = 5 mice per group, two-way repeated measures ANOVA, F(1,208) MOG35–55 treatment = 279, ***P < 0.001 in (b). (c) Neutrophil accumulation in the DRG 5 days after EAE induction in mice. Arrowheads indicate MPO (myeloperoxidase, red) and NE (neutrophil elastase, green) double-positive cells. The bottom images show enlarged images of the insets. DIC; differential interference contrast. Scale bar = 50 μm. Columns represent statistical data of neutrophil density in the DRG 5 days after MOG35–55 immunization. n = 5 mice per group, unpaired t-test, ***P < 0.001. (d) Immunoblot shows protein levels of CXCL1 in the DRG 5 days after MOG35–55 immunization. Columns represent statistical data of CXCL1 protein levels normalized to β-actin. n = 5 mice per group, unpaired t-test, ***P = 0.0003. (e) Fluorescent images of CXCL1 (green) and Nissl (red) in the DRG 5 days after MOG35–55 immunization. Scale bar = 50 μm. Columns represent statistical data of fluorescence intensity (FI) of CXCL1 in the DRG neurons. n = 5 mice per group, unpaired t-test, ***P < 0.001. All values are the mean ± SEM.

