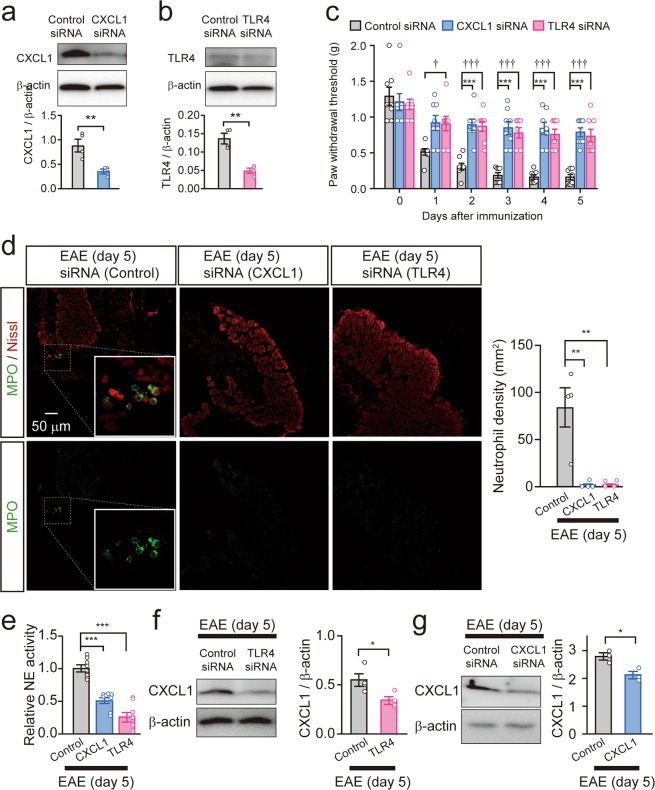
Figure 4.
Gene silencing of CXCL1 or TLR4 in the DRG attenuates neutrophil accumulation in the DRG. (a,b) Knockdown efficacy of CXCL1 or TLR4 siRNA in the DRG collected from naïve mice 5 days after the first siRNA treatment. Immunoblot shows CXCL1 (a) and TLR4 (b) in the DRG of siRNA-treated mice. Columns represent statistical data of CXCL1 (a) and TLR4 (b) protein normalized to β-actin. n = 4 mice per group, unpaired t-test, **P = 0.0079 in (a), **P = 0.0012 in (b). (c) Time course of mechanical allodynia after MOG35–55 immunization in control and CXCL1- or TLR4-knockdown mice. n = 8 mice per group, two-way ANOVA with Tukey’s multiple comparisons test. Control siRNA vs. CXCL1 siRNA, day 1: P = 0.0535; day 2: ***P = 0.0002; days 3–5: ***P < 0.0001; Control siRNA vs. TLR4 siRNA, day 1: †P = 0.0417; days 2–5: †††P < 0.0001. (d) Images show the immunofluorescence of MPO (green) and Nissl (red) in the DRG 5 days after EAE induction in siRNA-treated mice. The inset indicates an enlarged image. Scale bar = 50 μm. Columns represent statistical data of neutrophil density in the DRG 5 days after MOG35–55 immunization. n = 4 mice per group, one-way ANOVA with Dunnett’s test; Control siRNA vs. CXCL1 siRNA: **P = 0.0018; Control siRNA vs. TLR4 siRNA: **P = 0.0020. (e) Relative neutrophil elastase (NE) activity in the DRG 5 days after MOG35–55 immunization. n = 8 mice per group, one-way ANOVA with Dunnett’s test; Control siRNA vs. CXCL1 siRNA: ***P < 0.0001; Control siRNA vs. TLR4 siRNA: ***P < 0.0001. (f,g) Immunoblot shows protein levels of CXCL1 in the DRG 5 days after MOG35–55 immunization in TLR4- (f) or CXCL1-knockdown mice (g). Columns represent statistical data of CXCL1 protein normalized to β-actin. n = 3–4 mice per group, unpaired t-test, *P = 0.0318 (f) and *P = 0.0216 (g). All values are the mean ± SEM.

