Figure 4.
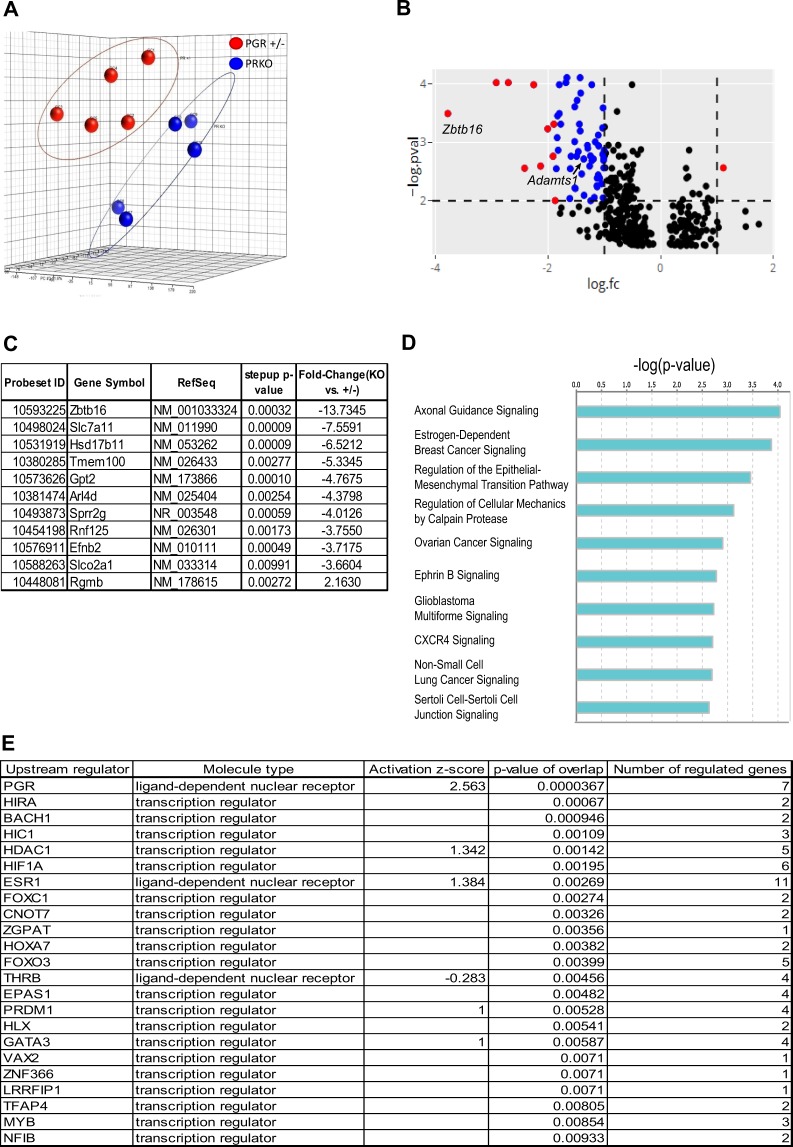
PGR-dependent differentially expressed genes in PRKO vs PGR +/− peri-ovulatory granulosa cells. (A) Principal components analysis (PCA) plot of granulosa cell microarray samples. (B) Volcano plot of granulosa cell microarray data. A total of 367 genes with log fold change >1 or <−1 are plotted. The horizontal dashed line indicates p-value cut-off (p-value < 0.01, or –log(p-value) >2). The vertical dashed lines indicate fold change cut-off (logFC <−1 or >1). Genes that meet these criteria are indicated as blue symbols. Genes that have been selected for panel C are indicated as red symbols. (C) Examples of genes that are significantly differentially expressed in PRKO granulosa cells. DEG selected are genes that were differentially expressed (FC >2 or <−2) with a p-value cut-off of 0.01. These genes are annotated as red points in panel B. (D) Canonical pathway analysis of PGR-regulated DEG identified in microarray. 61 DEG that were determined from granulosa cell microarray were analysed for enriched pathways using the IPA software. Pathways with a -log(p-value) cut-off above 2 (or p-value < 0.01) were determined to be significantly enriched. (E) IPA upstream regulator analysis of genes identified in microarray, showing upstream regulators that were significantly enriched (p-value < 0.01).

