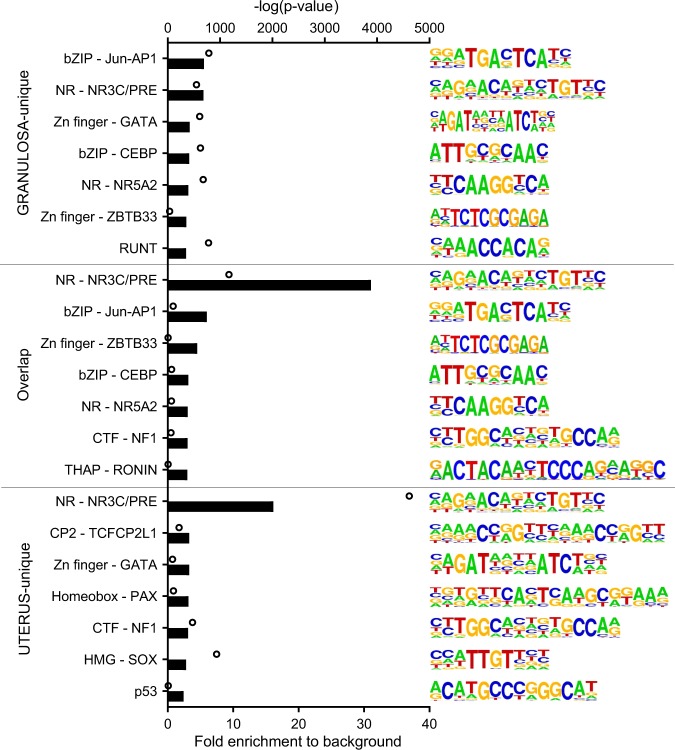
Figure 8.
Tissue specificity of PGR binding motifs in granulosa cells and uterus. PGR binding sites were divided by specificity to either granulosa cells, uterus or present in both (as in Fig. 7B) for motif analysis. Bars indicate fold enrichment to background. Circles indicate –log(pvalue). Among motifs found by HOMER that belong to the same TF family, the most conservative sequences are selected and ranked by fold enrichment compared to background frequency.

