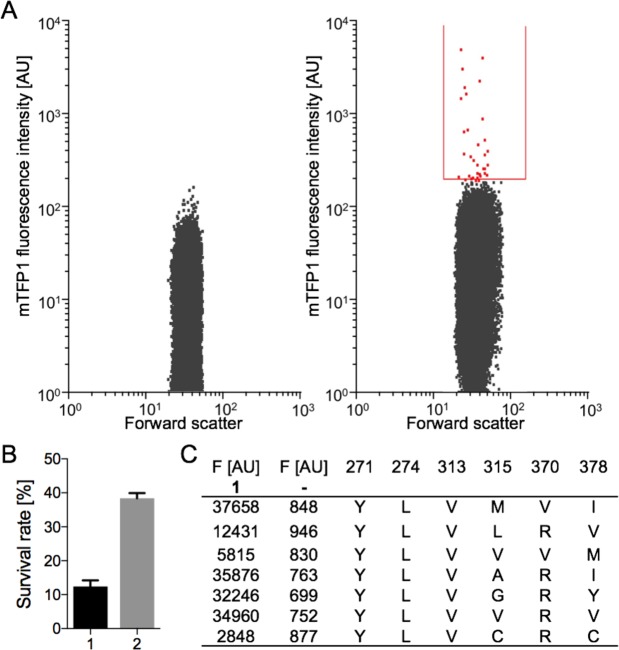
Figure 3.
Identification of PylRS variants for the incorporation of ncAA 1. (A) (Left plot) Fluorescence intensity and forward scatter of E. coli cells harboring pEVOL303_Lib in the absence of ncAAs analyzed by FACS. (Right plot) Cells harboring pEVOL303_Lib were grown in the presence of 1. Fluorescent cells (red) within the sort gate (red line) were separated from nonfluorescent cells. (B) Survival rate of cells after FACS in LB medium (1) and conditioned medium (2). Results were obtained from five independent experiments; standard deviation is indicated by error bars. (C) Fluorescence intensities of mTFP1TAG128 expressed with 1 or without – in the present of seven different PylRS variants (mutations are shown).

