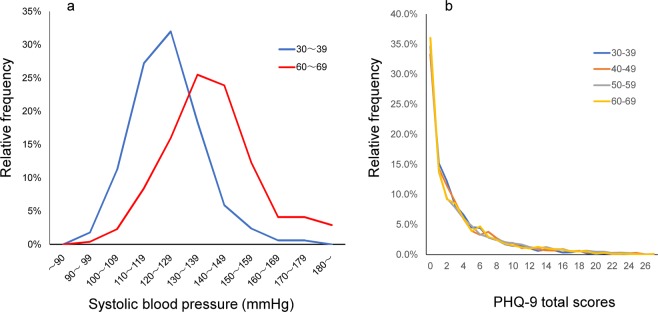
Figure 1.
(a) Distributions of systolic blood pressure for Japanese men in their 30 s (n = 169) and 60 s (n = 316). The blue line represents the distribution of systolic blood pressure in Japanese men during their 30 s (mean ± S.D. = 123.2 ± 12.5 mmHg). The red line represents the distribution of systolic blood pressure in Japanese men during their 60 s (mean ± S.D. = 137.4 ± 18.4 mmHg). Data were derived from the 2014 National Health and Nutrition Examination Survey in Japan: https://www.e-stat.go.jp/stat-search/files?page=1&layout=datalist&lid=000001151595.(b) PHQ-9 distributions during middle adulthood. The distributions of PHQ-9 scores were similar among the middle adulthood group (30 s, 40 s, 50 s, and 60 s) in the US general population. Data were derived from the 2009‒2014 United States National Health and Nutrition Examination Survey (n = 15,847). 10.3389/fpsyt.2018.00390.

