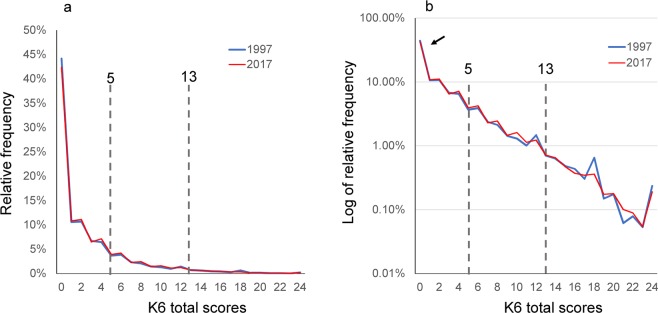
Figure 2.
(a) Comparison of K6 distributions between 1997 and 2017 groups. The two graphs for 1997 and 2017 appear as a single graph as they almost completely overlapped. (b) On a log-normal scale, the distributions for 1997 and 2017 exhibited a linear pattern with similar gradients on a log-normal scale, indicating that K6 total scores for the two groups followed an exponential pattern with similar rate parameters on a normal scale. As indicated by arrows, at the lower end, distributions for all groups exhibited higher frequencies compared to those predicted from the exponential pattern. Auxiliary lines indicate the cut-points for moderate and severe psychological distress (a score of 5 and 13, respectively).

