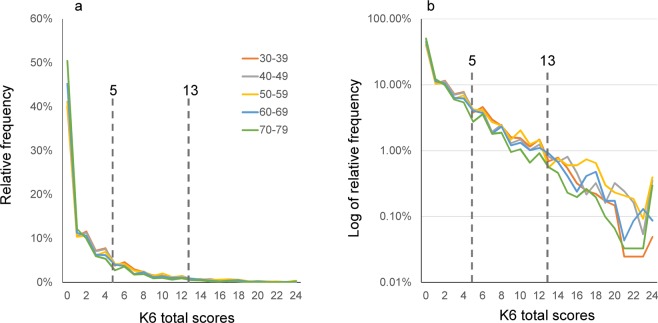
Figure 4.
(a) Comparison of K6 score distributions between the 30 s, 40 s, 50 s, 60 s, and 70 s groups. K6 score distributions were commonly right-skewed and similar among all age groups. (b) On a log-normal scale, the distributions for all year groups exhibited a linear pattern with similar gradients, indicating that K6 total scores for all age groups followed an exponential pattern with similar rate parameters. Compared to the graph including all age participants (Figs 3b and 4b, the curves appeared to fluctuate more randomly as the scores increased, likely reflecting the small sample sizes for higher scores. Auxiliary lines indicate the cut-points for moderate and severe psychological distress (a score of 5 and 13, respectively).

