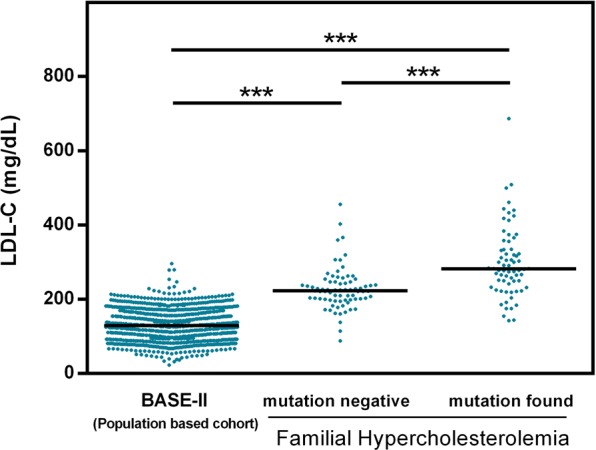
Figure 1.

LDL-C serum level according to the mutation status of the genes LDLR, APOB, and PCSK9. LDL-C serum concentrations (mg/dl) are shown for a population based cohort (BASE-II, N = 1631)). LDL-C serum concentrations of the hypercholesterolemic patients with respect to the mutation status in one of the three FH genes LDLR, APOB, PCSK9 (mutation negative (N = 75) vs. mutation found (N = 68)). Black lines indicate medians and dots single values. One-way ANOVA revealed significant differences between groups (p < 0.001). Post hoc Tukey’s test revealed significant differences between all possible pairs with ***indicating p < 0.001.
