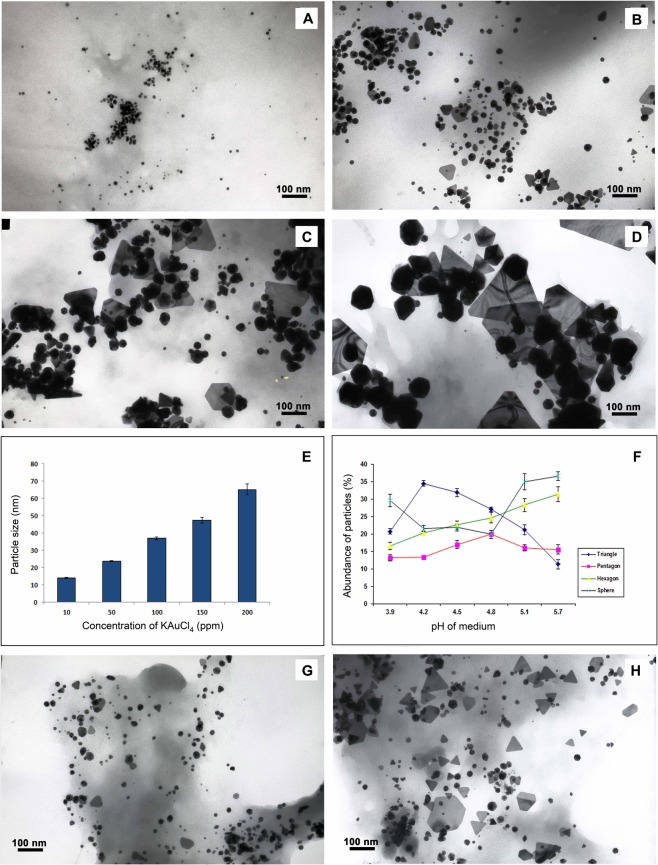
Figure 1.
Influence of reaction conditions on the geometry of AuNPs synthesized by the cells. Images (A–D) show variation in the size of nanoparticles synthesized under10, 50, 100 and 200 ppm of KAuCl4, respectively. (E) Displays the size of particles plotted against different concentrations of KAuCl4 used for induction. Values are means of 1,000 particles ± SE. Since p value is lower than 0.05 and the value of F is above F Crit in ANOVA, the difference between the groups is significant. (F) Indicates the abundance of AuNPs of different geometrical shapes plotted against changing pH of the medium. Images (G) and (H) display particles synthesized in the culture medium at pH 5.8 and 3.9, respectively. In ANOVA, p value is lower than 0.05 and F value is less than F Crit validating insignificant difference between the groups. Values are means of 1,000 particles ± SE.

