Figure 1.
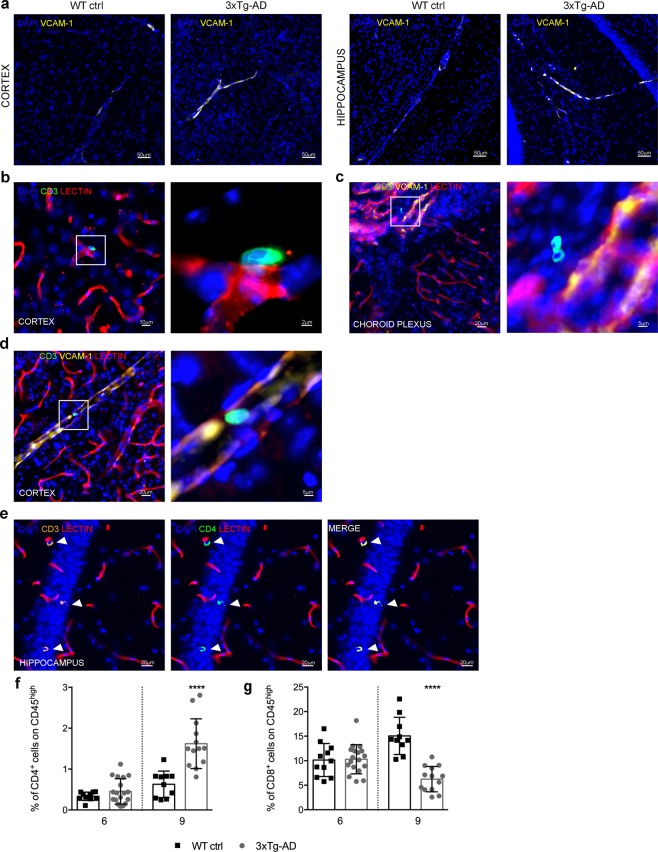
Presence of T cells near VCAM-1+ vessels in the brains of 3xTg-AD mice. (a) Confocal microscopy showing representative images of VCAM-1 expression in sections of the cortex and hippocampus in 3xTg-AD mice compared to wild-type control mice (WT ctrl) at 6 months of age. (b) Extravasation of a CD3+ T cell from a cortical vessel stained with lectin in a 3xTg-AD mouse (magnification of the quadrant is shown in the right-hand image). (c) Presence of an extravasated CD3+ T cell near a VCAM-1+ vessel in the choroid plexus (magnification of the quadrant is shown in the right-hand image). (d) Adherent T cell inside a VCAM-1+ vessel in the cortex (magnification of the quadrant is shown in the right-hand image). Nuclei are stained with DAPI (blue), blood vessels are marked with Texas Red tomato lectin (red), VCAM-1 is stained with an antibody conjugated to Alexa Fluor 647 (yellow), and T cells are stained with Alexa Fluor 488 using an anti-CD3 monoclonal antibody (green). (e) Infiltrating CD3+ (orange)/CD4+ T cells (green) highlighted with arrowheads in the hippocampus of 3xTg-AD mice at 6 months of age. Quantitative flow-cytometry analysis of infiltrating CD4+ (f) and CD8+ T cells (g) in 3xTg-AD mice (black bars) compared to wild-type control mice (WT ctrl) (grey bars) at 6 and 9 months of age. Data are expressed as mean ± SD. (****P < 0.0001; Mann-Whitney U-test). At 6 months: n = 11 mice (5 F, 6 M) for the WT ctrl group and n = 18 mice (9 F, 9 M) for the 3xTg-AD group. At 9 months: n = 10 mice (5 F, 5 M) for the WT ctrl group and n = 13 mice (7 F, 6 M) for the 3xTg-AD group.

