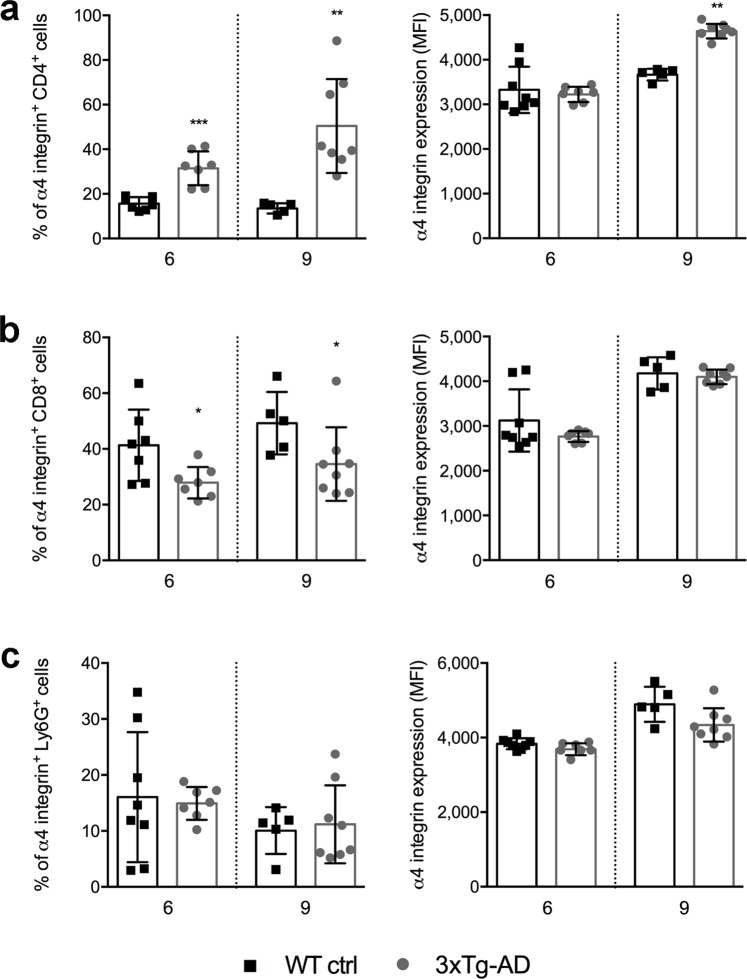
Figure 2.
The expression of α4 integrin on circulating leukocytes in 3xTg-AD mice. Quantitative flow-cytometry analysis of peripheral CD4+ T cells (a), CD8+ T cells (b) and Ly6G+ cells (c) in 3xTg-AD mice (white bars) compared to wild-type control mice (WT ctrl) (black bars) at 6 and 9 months of age. For all cell populations, the graphs show the proportion of cells expressing α4 integrin and the mean fluorescence intensity (MFI) of normalized α4 integrin expression. Error bars represent SD (*P < 0.05, **P < 0.01, ***P < 0.001; Mann-Whitney U-test). At 6 months: n = 8 mice (3 F, 5 M) for the WT ctrl group; n = 7 mice (3 F, 4 M) for the 3xTg-AD group. At 9 months: n = 5 mice (2 F, 3 M) for the WT ctrl group and n = 8 mice (4 F, 4 M) for the 3xTg-AD group.

