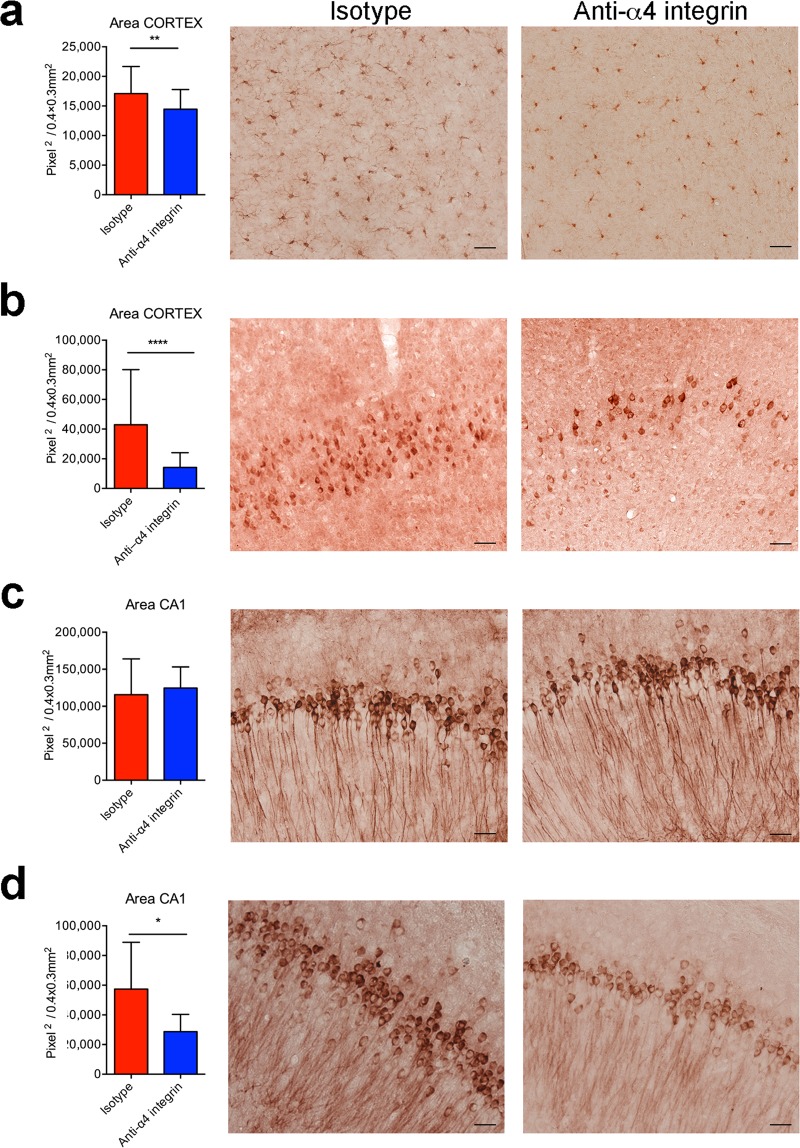
Figure 7.
Inhibition of α4 integrins at the late stage of AD reduces microglial activation, Aβ load and hyperphosphorylated tau in 3xTg-AD mice. Mice were treated with the α4 integrin-specific antibody or isotype control at 9 months of age for 4 weeks and were euthanized for neuropathological analysis at 11–12 months of age. (a) Bar graph shows significant differences in microglial activation in the cortex and CA1 hippocampal region of treated mice and isotype controls. Error bars show SD (**P < 0.01; Unpaired t-test). Representative images show Iba-1 staining of microglia in the cortex of isotype controls (left) and after the α4 integrin blockade (right). (b) Quantitative analysis of Aβ accumulation in the CA1 sub-field of hippocampus (left). Error bars show SD (****P < 0.0001; Unpaired t-test). Representative images show Aβ deposition in the hippocampus of 3xTg-AD mice treated with isotype controls (left) and after the α4 integrin blockade (right). (c) Quantitative analysis of total tau protein in the CA1. Representative images show staining for total tau in isotype controls (left) and the α4 integrin blockade (right). (d) Quantitative analysis of the area of AT180+ cells in the CA1 of 3xTg-AD mice. Results are shown as mean ± SD (*P < 0.05; unpaired Student’s t-test). Representative images show AT180+ cells in isotype controls (left) and after the α4 integrin blockade (right). Scale bar in all images = 50 μm In all panels, n = 3 mice (2 F, 1 M) for the isotype group and n = 3 mice (2 F, 1 M) for the anti-α4 integrin group.

