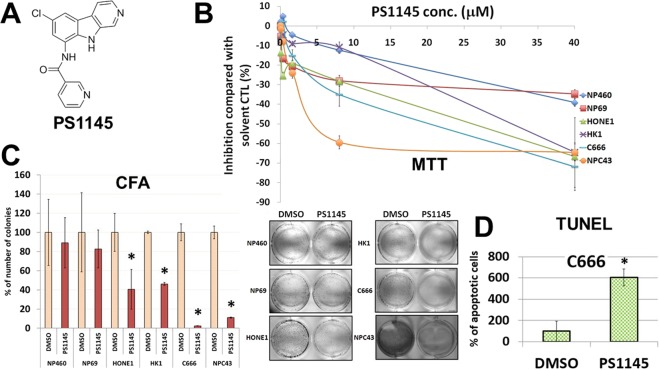
Figure 1.
(A) Structure of PS1145. (B) Effects of the small molecule kinase inhibitor PS1145 on cell viability in NPC and NP cell lines. The cell viability for all NPC cell lines were determined using the MTT assay (on day 3 after the treatment). (C) 2D CFA analysis of the effects of PS1145 on the colony-forming abilities of the selected NPC and NP cell lines. The bar chart shows the percentage of colony formation by each cell line treated with DMSO solvent control and PS1145. These experiments were conducted in triplicates. *p value < 0.05. Representative images of the CFA results are shown. (D) Apoptosis analysis of the effects of PS1145 in C666 cells treated. The TUNEL assay was used to detect the apoptotic cells on day 3 after the treatment with 32 μM PS1145. The bar chart shows the percentage of number of apoptotic cells formed after treatment with PS1145 or the solvent control (DMSO). *p value < 0.05.

