Figure 4.
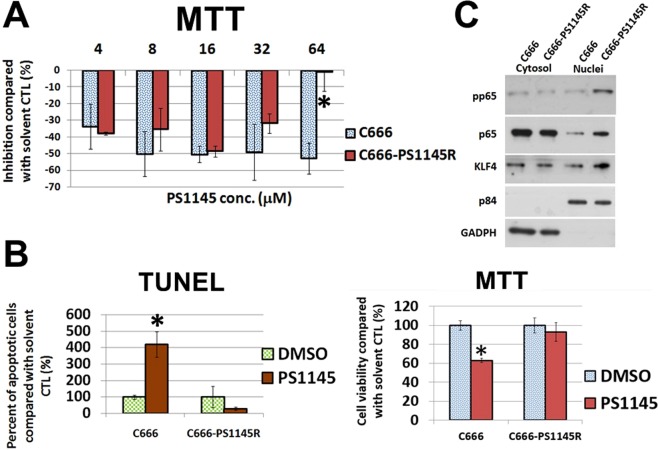
(A) Comparison of cell viability of C666 cells and its resistant derivative C666-PS1145R in response to PS1145 (4–64 μM). The cell viability was determined by MTT assay on day 3 after the treatment. The bar chart shows the percentage of number of viable cells treated with different concentrations of PS1145. *p value < 0.05. (B) Apoptosis analysis of the effects of PS1145 in C666 cells and its resistant cell line C666-PS1145R. The effects of 32 μM PS1145 on the formation of apoptotic cells of the parental C666 and its derivative C666-PS1145R were detected by TUNEL assay on day 3 after the treatment. The bar chart shows the percentage of number of apoptotic cells formed in the treatment with PS1145 or DMSO. *p value < 0.05. A parallel MTT assay was performed for the same batch of cell lines. (C) Western blot analysis of protein expression in C666 versus C666-PS1145 cells. The cytosolic and nuclei fractions of the proteins of interest were compared between the two cell lines. The p84 and GADPH are the nuclei and cytosol loading controls.

