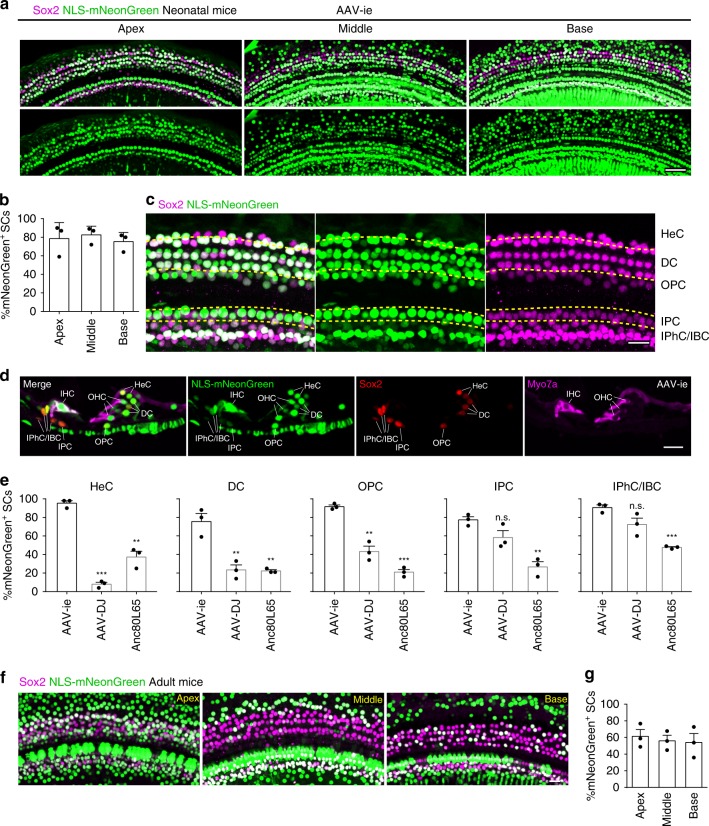
Fig. 2.
Adeno-associated virus-inner ear (AAV-ie) efficiently targets cochlear supporting cells in neonatal and adult mice. a Images of the apical, middle, and basal turns of cochlea injected at P3 with AAV-ie-NLS-mNeonGreen (nuclear localization sequence-mNeonGreen) at a dose of 1 × 10¹⁰ genome-containing (particles) (GCs) per ear. Green: NLS-mNeonGreen; magenta: Sox2. Scale bar, 50 µm. b Percentage of NLS-mNeonGreen-positive supporting cells (SCs) per 100 µm corresponding to a. Data are shown as mean ± SEM. N = 3 mice. Source data are provided as a Source Data file. c Confocal images of Hensen’s cells (HeCs), Deiters cell (DCs), outer pillar cells (OPCs), inner pillar cells (IPCs), inner phalangeal cell (IPhCs), and inner border cell (IBCs) in apical turn of cochleae injected with AAV-ie-NLS-mNeonGreen. Green: NLS-mNeonGreen; magenta: Sox2. Scale bar, 20 µm. d Cross-section of AAV-ie-NLS-mNeonGreen injected cochlea (1 × 10¹⁰ GCs per ear). Green: NLS-mNeonGreen; red: Sox2; magenta: Myo7a (a marker for hair cells). Scale bar, 20 µm. e Infection efficiencies of Anc80L65, AAV-DJ, and AAV-ie at an equal dose (1 × 10¹⁰ GCs) in HeCs, DCs, OPCs, IPCs, IPhC/IBCs, respectively, are quantified. Data are shown as mean ± SEM. p Value is calculated by Student’s t test. n.s. refers to no significance. *p < 0.05, **p < 0.01, and ***p < 0.001. N = 3 mice. Source data are provided as a Source Data file. f Representative confocal images of cochlear supporting cells of adult mice injected with AAV-ie-NLS-mNeonGreen. Green: NLS-mNeonGreen; magenta: Sox2. Scale bar, 20 µm. g Infection efficiencies of AAV-ie-infected SCs in adult mice. Data are shown as mean ± SEM. N = 3 mice. Source data are provided as a Source Data file. For neonatal mice (a–e), all cochleae were harvested at day 14 after microinjection with 1.5 µL of AAV stock solution at P3. While for adult mice (f, g), all cochleae were harvested 14 days after microinjection at P30

