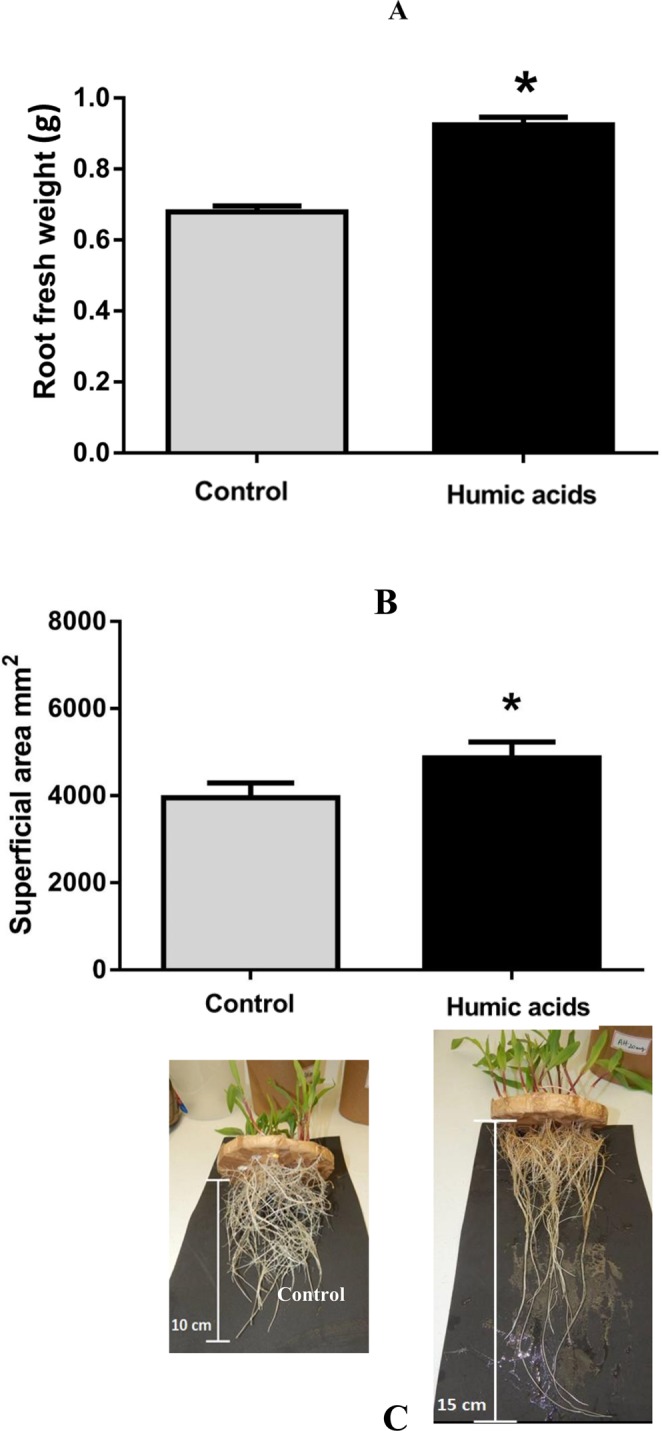
Figure 1.

Fresh weight of the roots of maize seedlings grown under two conditions. Each column represents the mean and standard deviation of the thirty plants (A). Radicular superficial area of maize seedlings analyzed by SAFIRA software. Each column represents the mean and standard deviation of fifteen plants (B). Statistical analysis of the three replicates using the t-test. Asterisks indicate significant differences at p < 0.05. In the photos in (C), it is possible to see the difference in maize roots.
