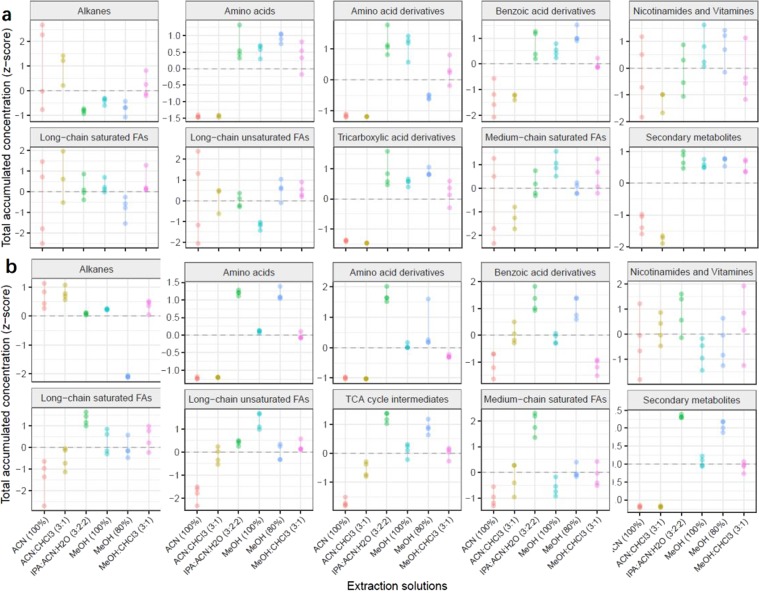
Figure 7.
The dot-line graphs show the total concentrations of metabolites in each metabolic biochemical class across six different extraction solvents for adult (a) and baby (b) giant panda feces. Each dot represents a sample concentration. Red dots: ACN (100%); green dots: MeOH (100%); blue dots: MeOH (80%); cyan dots: ACN:CHCl3 (3:1); purple dots: IPA:ACN:H2O (3:2:2); yellow dots: MeOH:CHCl3 (3:1). The vertical lines are the standard deviation of each extraction method. The metabolite concentrations were standardized to Z-scores.

