Figure 7.

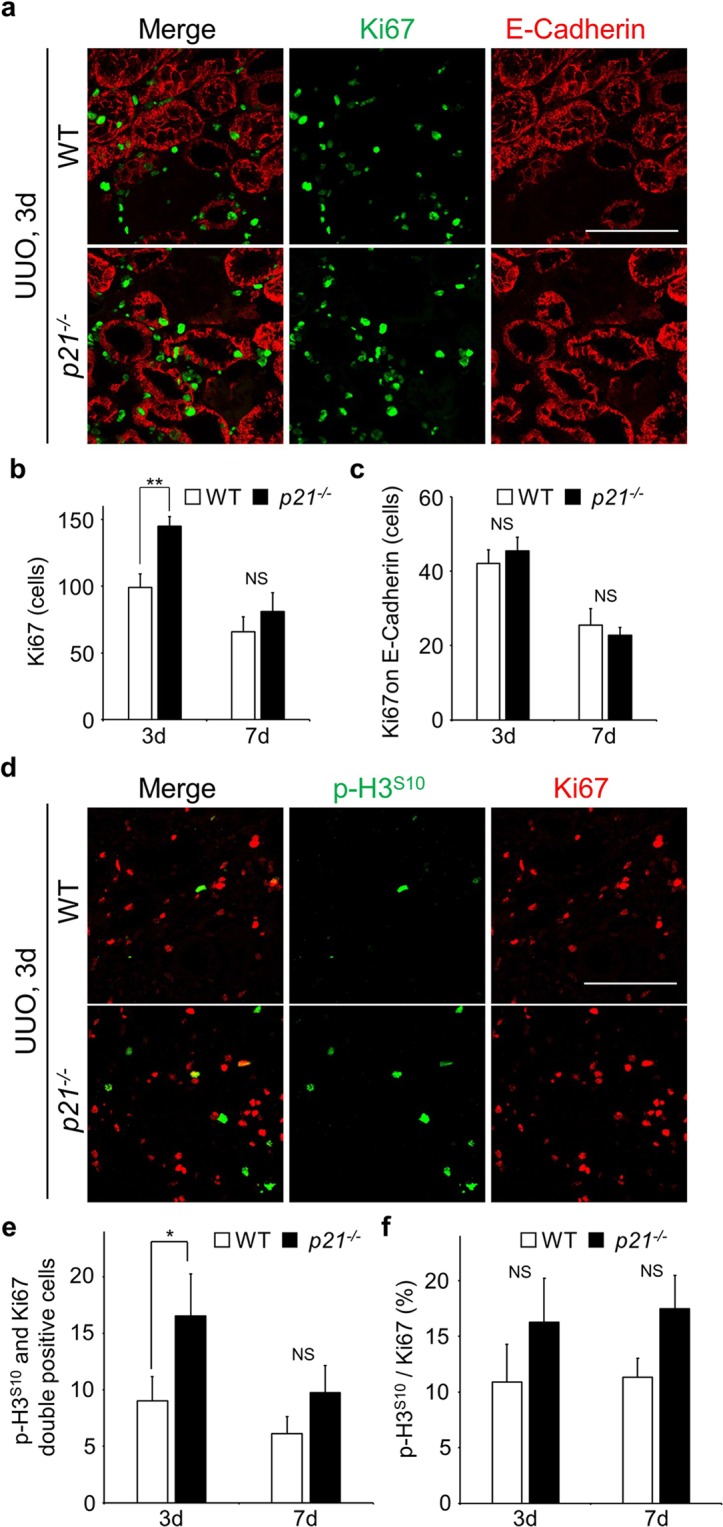
The proliferative cells are increased in p21 deficient mice. (a) Co-immunostaining with Anti-Ki67 (green) and Anti-E-Cadherin (red). Scale bar, 100 µm. (b) Quantification of the number of Ki67 positive cells. (c) The number of Ki67 positive cells on E-Cadherin stained area (Ki67 and E-Cadherin double stained cells). N = 3 different mice for each time points in each genotypes. (d) Co-immunostaining with Anti-p-H3S10 (green) and Anti-Ki67 (red). Scale bar, 100 µm. (e) The number of p-H3S10 and Ki67 double positive cells. (f) The ratio of p-H3S10 per Ki67. Values were calculated by dividing the number of p-H3S10 and Ki67 double positive cells by the number of Ki67. N = 3 different mice for each time points in each genotypes. Data are as given averages ± SD; *P < 0.05; **P < 0.01; NS, Not Significant (two-tailed unpaired Student’s t-test).
